




The actual net debt of the U.S. federal government is neither extraordinary nor out of control. It is the subject of public opinion manipulation by certain entities. It obscures the significance of a monetary bubble worth… 15,000 billion dollars!
***
The U.S. government publishes the gross federal debt figure daily; as of August 20, 2026, it stands at… 40,047 billion dollars (Total Public Debt Outstanding, circled in red), which is considerable and is what scares everyone!
Document 1:
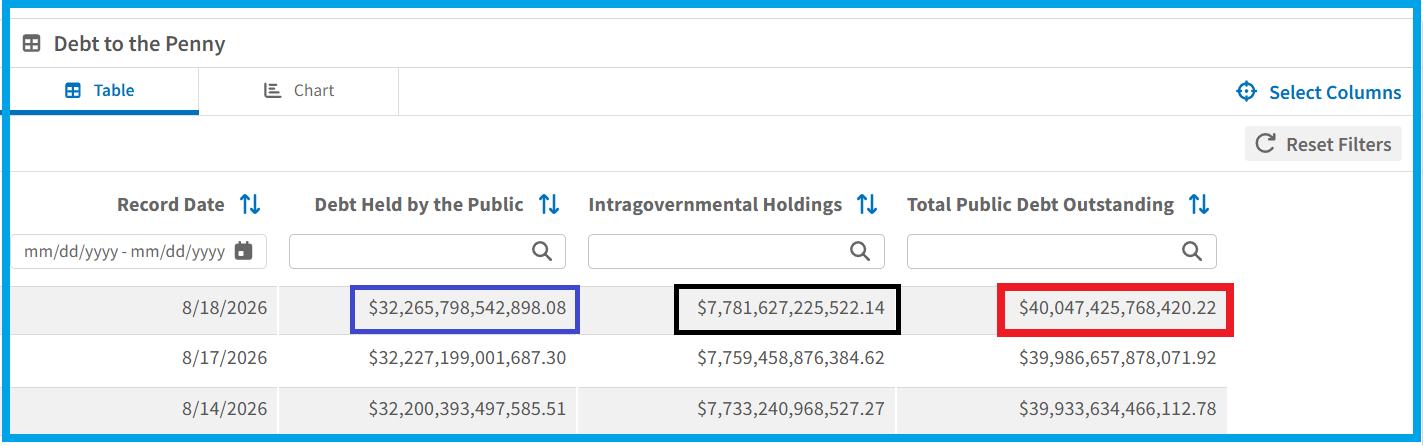
However, this document shows that government entities (Intragovernmental Holdings) hold 7,781 billion dollars of this federal debt (circled in black), which means that the federal government has both these debts and these claims on… itself!
To determine the actual amount of the net federal debt at this point, we must subtract from the gross debt the amount of debt the federal government holds on itself—that is, these 7,781 billion dollars (circled in black)—which brings the actual net federal debt down to 32,266 billion dollars (Debt Held by the Public, circled in blue).
[40,047 – 7,781 = 32,266]
Furthermore, the Federal Reserve Bank of St. Louis’s FRED database specifies that the federal government’s cash balance is currently… 964 billion dollars, the latest figure published to date!
Document 2:
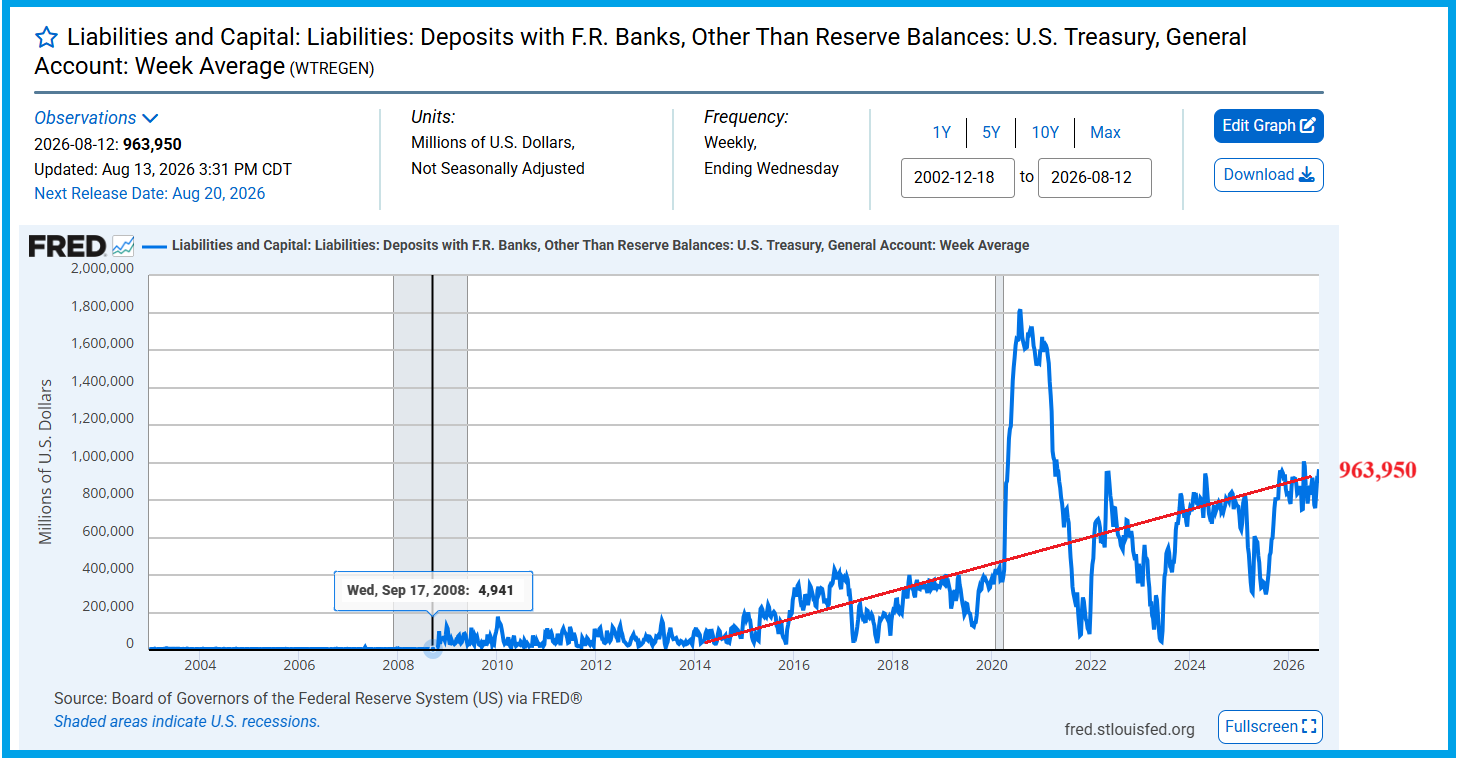
To understand this issue, one must consider that the U.S. government must pay federal government bills and repay maturing loans every day using resources provided by taxpayers—that is, their taxes.
However, until September 17, 2008, the U.S. government had been carrying out these operations with cash reserves of only about… $5 billion.
However, everything changed as of September 17, 2008: the government’s cash reserves first surged to $100 billion and then fluctuated up to $400 billion.
Worse still, in 2020, the government’s cash reserves skyrocketed to… $1,817 billion!
Why did U.S. administrations seek to accumulate cash reserves that were—and still are—completely out of proportion to their needs for financing expenditures?
No sensible answer has been given by the successive Secretaries of the Treasury—all the more easily… since no sensible questions were ever asked of them on this subject!
The federal government’s cash reserves therefore currently stand at 964 billion dollars as of August 20, the latest figure published to date.
To determine the amount of the actual net federal debt at this level, one must therefore subtract the astronomical amount of the federal government’s cash reserves (i.e., 964 billion dollars) from the previously determined debt amount, which is 31,302 billion dollars.
[32,266 – 964 = 31,302]
Furthermore, the U.S. government publishes the Fed’s balance sheet weekly, which lists among its assets… 4,542 billion dollars in government securities consisting of Treasury bills.
Document 3:
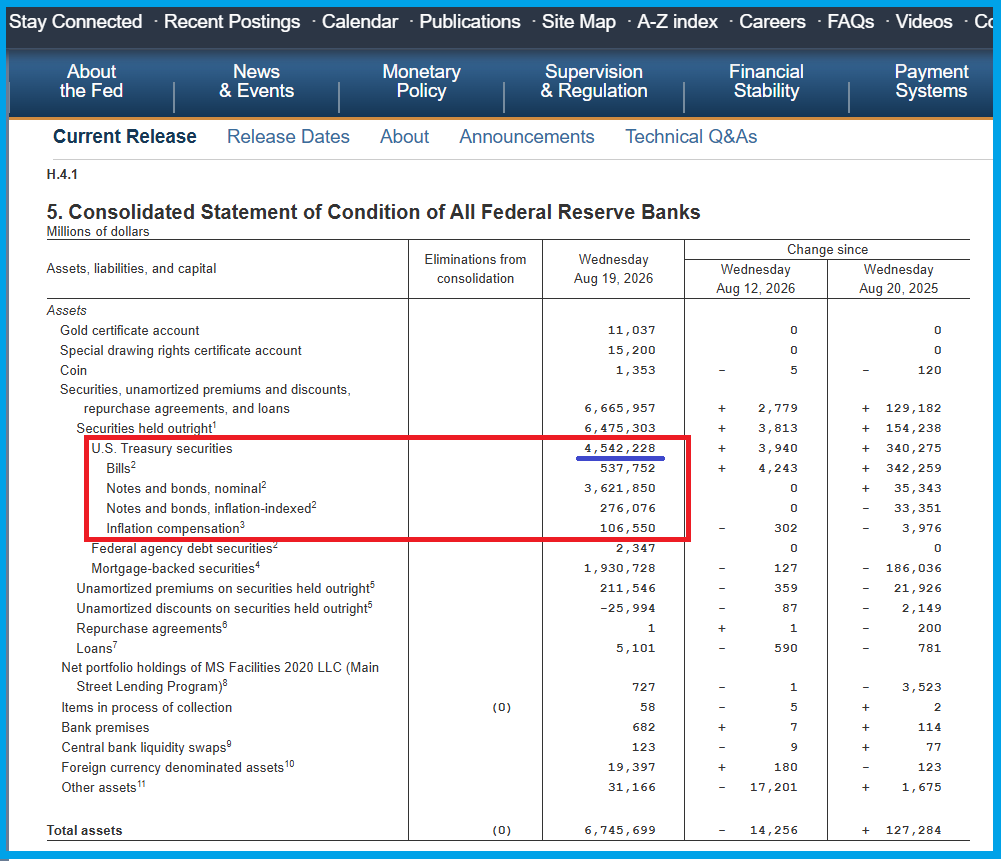
However, these 4,542 billion dollars are intended to be repaid by the federal government itself, and the Fed is supposed to return these funds to the federal government at the end of each fiscal year.
For the same reasons as before, we must therefore subtract these 6,471 billion dollars from the federal government’s debt amount determined earlier (i.e., 31,302 billion dollars) to obtain the actual amount of the federal government’s net debt, which is 24,830 billion dollars (taking into account the hundreds of millions of dollars).
[31,302 – 4,542 = 26,760]
The federal government’s actual net debt is therefore ultimately 24,830 billion dollars, which can be compared to the current annual GDP of 32,475 billion dollars (as of July 30, 2026) according to the latest figures published to date,
Document 4:
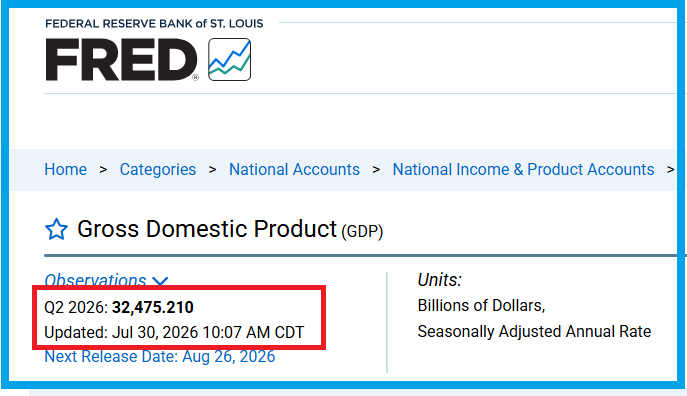
The federal government’s actual net debt therefore represents only… 82.40% of the annual GDP of the United States, which is considered normal, and not 120% as erroneously stated by everyone—and even by U.S. authorities!
[26,760 / 32,475 * 100 = 82.40%]
The first question that arises is this: why does everyone repeat the data published by U.S. authorities without even the most basic analysis?
The second question that arose in early 2025 was this: will the new Secretary of the Treasury, Scott Bessent, restore some order to the federal government’s cash management?
Scott Bessent has only made matters worse for America because, when he took office as Treasury Secretary, the debt-to-GDP ratio was just 80.1 percent (see my article from February 2, 2025), whereas today that ratio has risen to over 82.4 percent!
***
Summary table showing the transition from gross to net debt in the United States,
Document 5:
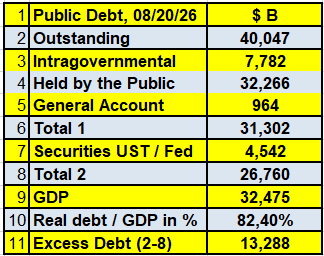
The difference between the federal government’s gross debt—40,047 billion dollars—and its net debt—26,760 billion dollars—is therefore… 13,288 billion dollars (line 11 of Document 5)!
Thus, $13,000 billion has been improperly subtracted from the U.S. M3 money supply to obscure the magnitude of the monetary bubble that has developed there since the end of the Cold War!
This $13,000 billion in excess money is in addition to the $11,000 billion found in the M3 money supply that I have reconstructed.
Thus, there are 24,000 billion U.S. dollars unduly in circulation, creating a monetary hypertrophy that is always lethal “in the long run”, which means “at an indeterminate date,” but it is certain that this bubble dooms America to a historic momentum crash unlike anything this country has ever seen.
Document 6:
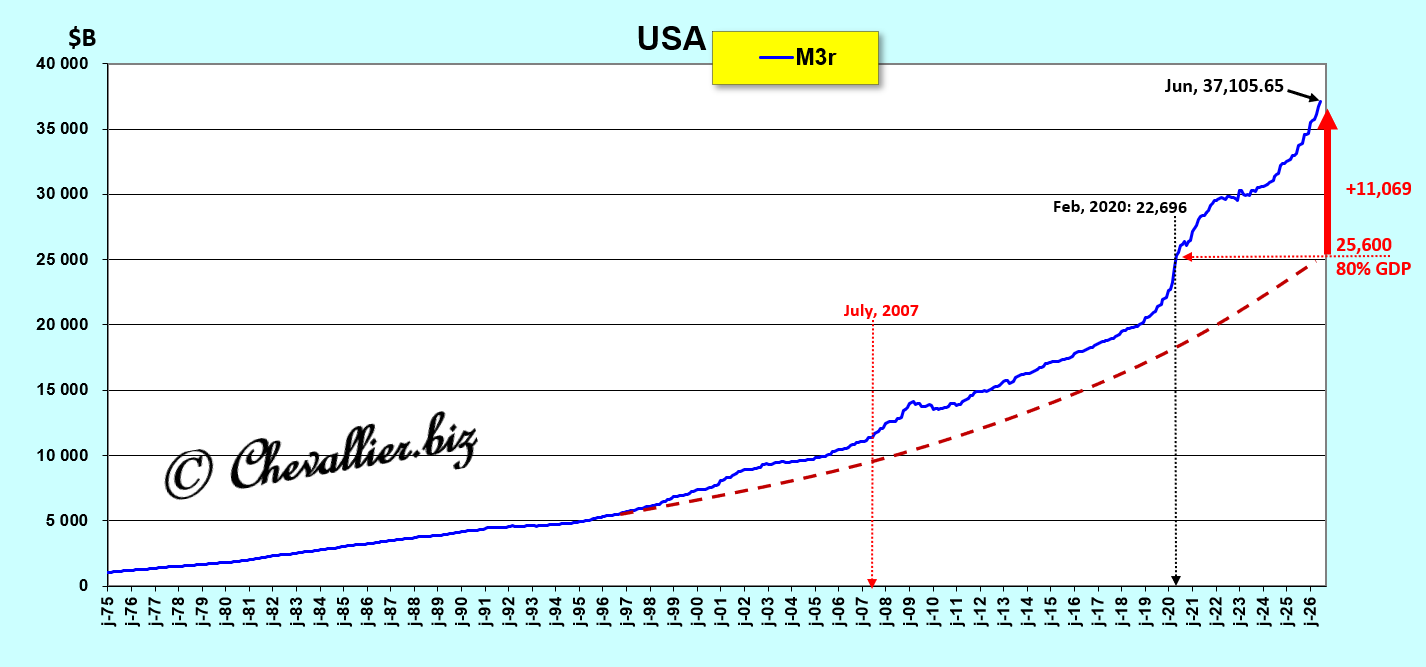
The major problem facingAmerica is not its debt, but its monetary bloat, which far exceeds normal levels—see my articles on this subject!
Indeed, it appears that the U.S. M3 money supply amounts to 114% of current annual GDP, whereas this ratio should not exceed 80%—see my upcoming article updating these figures!
Document 7:
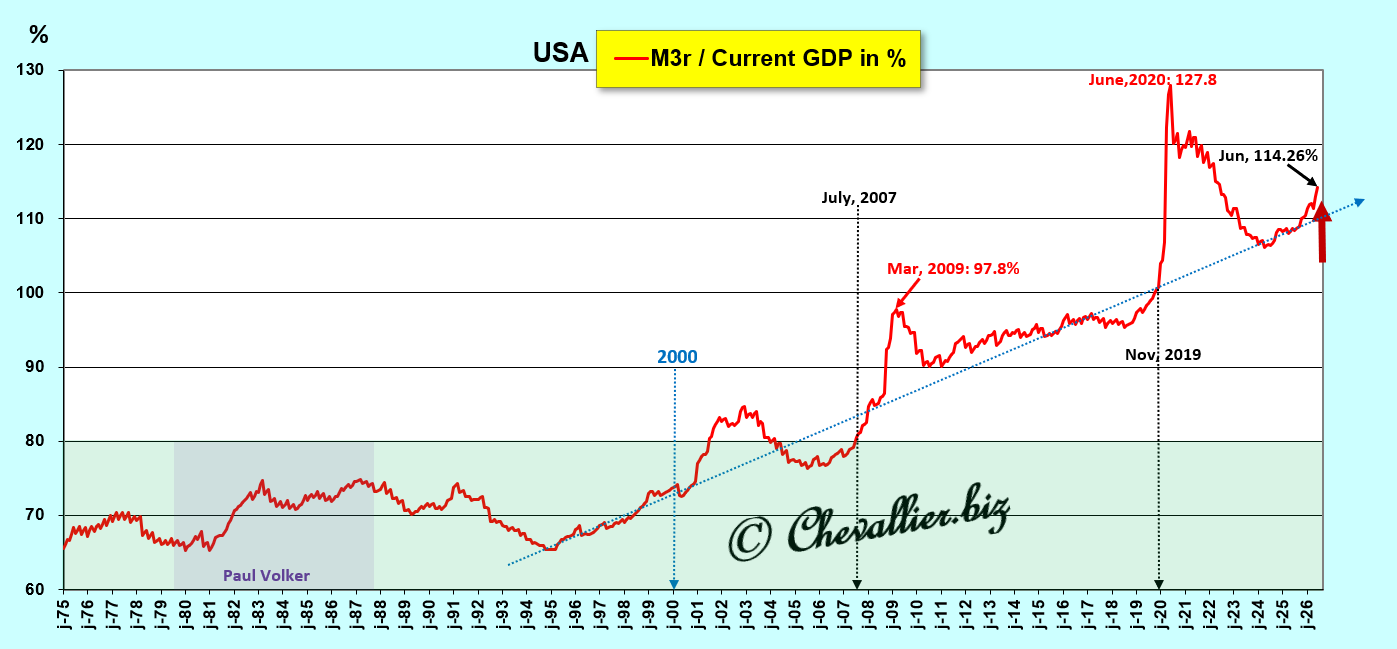
Those who manipulate financial markets and public opinion lead everyone to believe that U.S. public debt is a major and serious problem, which is not the case.
In doing so, they obscure the existence of this monetary bubble—and it is this bubble that poses the biggest problem; such a bubble is always fatal in the long run!
The size of the U.S. public debt is therefore a red herring, a trap.
It is surprising that I am the only one, to my knowledge, to have identified this by analyzing it in an irrefutable manner, since all my sources are official and verifiable, and my methodology is reproducible.
As a reminder, sound money is the first pillar of Reaganomics, and of monetarism, according to Arthur Laffer.
***
Click here to access the U.S. government website page that publishes the federal government’s debt figures on a day-to-day basis.
Click here to access the page on the Federal Reserve Economic Data (FRED) website that publishes U.S. Treasury cash flow figures.
Click here to access the page on the Fed’s website that publishes its latest balance sheet.
Click here to access the page on the FRED website that publishes GDP figures.
Click here to read my February 2, 2025, article on this topic on my French-language website.
Click here to read my previous article on this topic on my French-language website.
Click here to read my previous article on this topic on my English-language website.
©Chevallier.biz