




Abstract
A hypertrophy of the M3 money supply has been occurring in the United States since the early 2000s, as clearly shown by the graph depicting the ratio of M3 to current GDP (as a percentage).
Document 1:
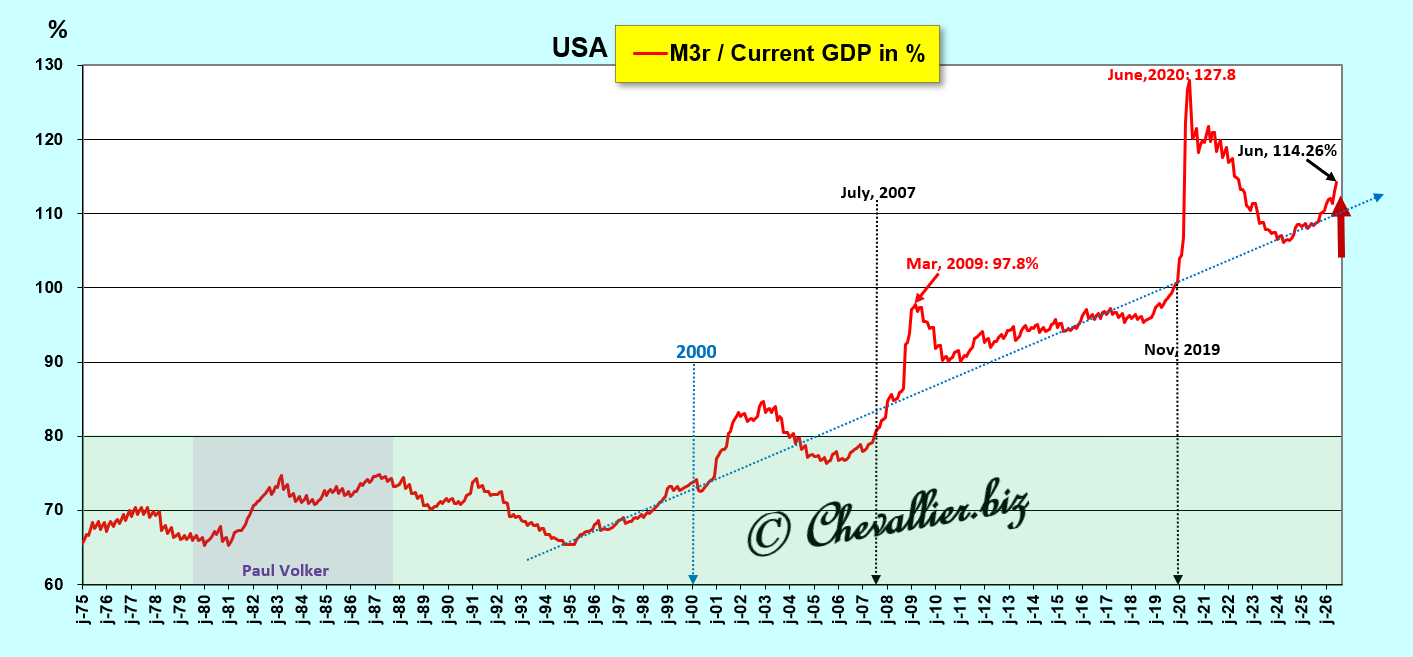
This hypertrophy of the M3 money supply poses a serious threat to the fundamental economic balance of America.
Its increase leads to a decline in real GDP, and vice versa, according to the law of free money supply.
Document 2:
My analyses and conclusions contradict most studies on this subject, but they are based on the observation of real and indisputable data.
Consequently, the entire body of economic and monetary theory must be rethought.
One solution to restore America’s fundamentals and reintroduce sound money would be to trigger a major global economic crisis by bursting the monetary bubbles…
***
We live in an increasingly financialized world, yet paradoxically, economists are attaching less and less importance to what is, in fact, fundamental: the relationship between the money supply and wealth creation—that is, GDP.
Yet this was the major issue that the monetary authorities of the so-called Western countries monitored very closely—and successfully—during the second half of the 20th century.
The purpose of this article is to return to these fundamentals and bring them up to date…
***
Every fully independent and sovereign country has its own currency.
However, the example of Germany between the two world wars showed that when a nation’s monetary authorities allow excessive money supply growth to develop, a major economic crisis ensues—one that can even have catastrophic global consequences.
This is why, after World War II, the monetary authorities of developed countries acted vigorously and effectively to prevent monetary bubbles from forming in Western nations—a task that Karl Otto Pöhl accomplished remarkably well during his tenure as president of the Bundesbank.
Thus, during the second half of the 20th century, all central bank governors in the countries of the so-called free world perfectly managed fluctuations in monetary aggregates so as to keep them within optimal limits, without, however, defining them theoretically or empirically in relation to a baseline measure—namely, GDP.
However, it is possible to define these limits (by quantifying them) based on the statistical series published by the Fed over the long term, dating back to the postwar period, which helps us better understand that it is fluctuations in monetary aggregates that are the primary and fundamental cause of fluctuations in real GDP (in the opposite direction), all other things being equal.
As a reminder, a nation’s total money supply, denoted M3, is the sum of three monetary aggregates…
The monetary aggregate M1 is the sum of positive current account balances and currency in circulation, and the M1/GDP ratio (as a percentage) must not exceed 15% of annual current GDP.
The monetary aggregate M2 consists of the sum of the M1 aggregate and the M2-M1 aggregate, which includes savings account deposits. This M2-M1/GDP ratio (as a percentage) must be less than 40% of current GDP.
Finally, the M3-M2 aggregate corresponds to the total cash holdings of corporations and money market funds. This M3-M2 / GDP ratio (as a percentage) must be less than 25% of current GDP.
These limits had never been exceeded simultaneously in the United States prior to 2006,
Document 3:
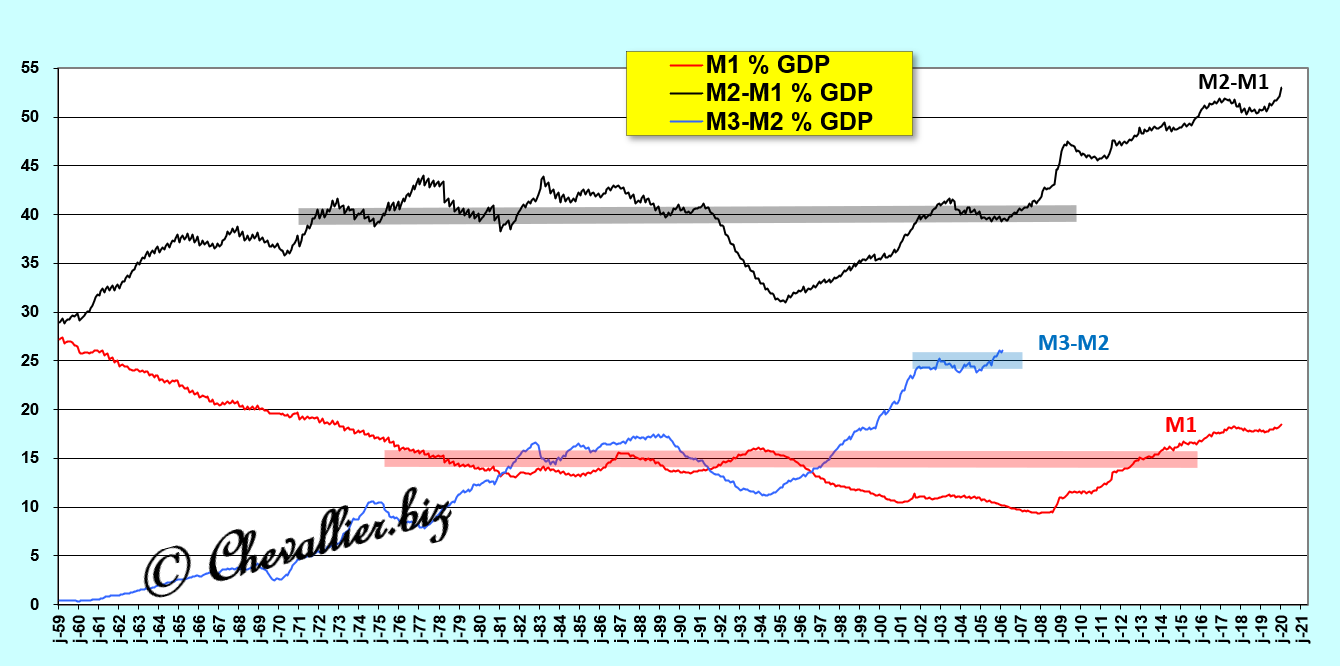
Thus, the M3/GDP ratio (as a percentage) should never exceed 80 percent of current GDP.
This raises a problem: Ben Bernanke had the publication of figures on the total U.S. money supply, M3, banned as soon as he took office as Fed Chair in February 2006, so that monetarist economists could no longer analyze them and draw conclusions that are, however, essential!
However, I have managed to reconstruct the amount of the U.S. money supply M3—which I denote as M3r, with an r for revised—based on the components that make up the M3-M2 aggregate, which are still published elsewhere…
In fact, a nation’s total money supply M3 consists, on the one hand, of the monetary aggregate M2 (the figures for which are still published monthly in the United States) and, on the other hand, of money market mutual funds (MMMF) and total corporate cash flow (Corporate net cash flow).
The Federal Reserve Bank of St. Louis’s FRED database publishes this data quarterly for money market mutual funds (MMMF) under the code MMMFFAQ027S and for corporate net cash flow under the code CNCF.
Thus, for the period from 1976 to 1990, the curves derived from the series published by FRED based on M3 aggregate figures (published by the Fed) coincide perfectly with those of the M3r figures calculated from the sum of the M2 aggregate, money market mutual funds, and corporate net cash flow.
Subsequently, a divergence becomes apparent, which eventually tends to narrow in 2006.
Document 4:
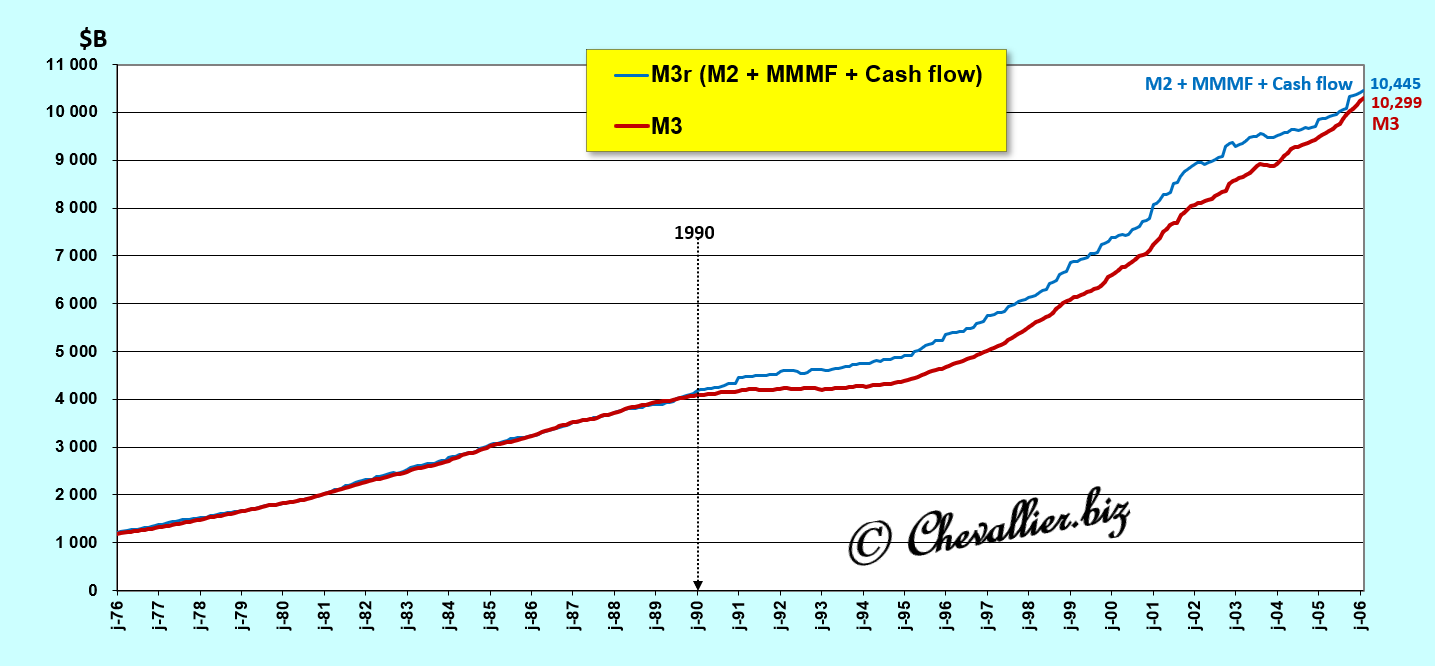
Consequently, based on this redefinition of the U.S. M3 money supply from 1976 to the present, it is possible to quantify the relationships between changes in this M3 money supply and those in GDP.
It then appears (to simplify) that an increase in the M3 money supply held by Americans leads to a decline in real GDP, and conversely, which holds true over the long term, since 1976—that is, since FRED began publishing these data.
More specifically, it is the change in what I call the free money supply M3—which is the difference between, on the one hand, the change (year-over-year, in percentage terms) in the M3 money supply, and, on the other hand, (minus) the change in real GDP (year-over-year, in percentage terms)—that causes a reaction opposite to the change in this real GDP.
Document 5 (identical to Document 2):
In the first part, we will therefore analyze the characteristics of the changes in the M3r money supply, and in the second part, the changes in real GDP relative to those of the free money supply M3r.
***
Part One: Analysis of the Characteristics of Changes in the M3r Money Supply
Since the beginning of 2022, month-over-month changes in the U.S. M3r money supply have been of significant magnitude, with peaks reaching nearly $800 billion—as was the case in January 2026, for example!
Document 6:
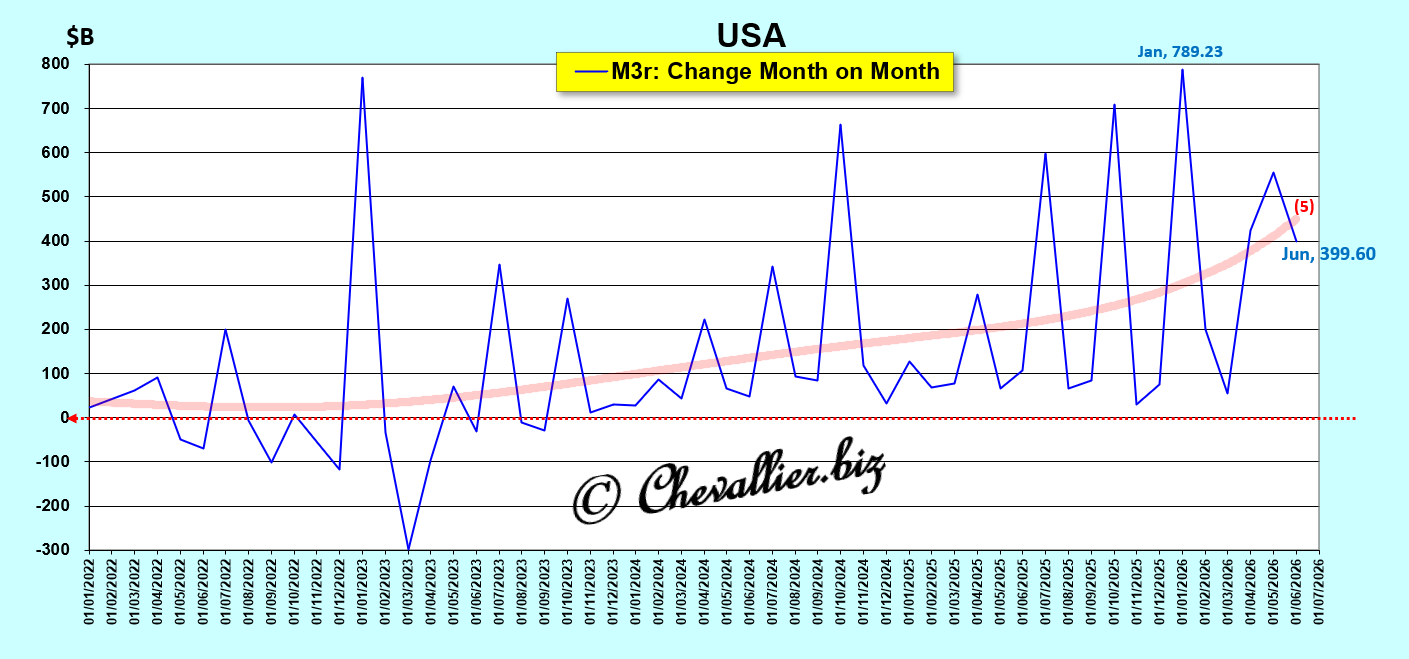
These quarterly peaks can be explained by the fact that data on the M3-M2 monetary aggregate are published on a quarterly basis; these data would need to be arbitrarily smoothed over three months to provide a more accurate picture of reality, which would then reveal the significant increase in the M3 money supply in April and May 2026 due to the rise in the M2 monetary aggregate, which is caused by an increase in precautionary savings linked to the wars in the Middle East; see my previous article on M2.
However, the light red fifth-order polynomial trend line provides an accurate picture of the trend in the rate of increase of… the rate of increase of this money supply, that is, its second derivative.
Month-over-month fluctuations in the M3r money supply were small in the 20th century, with peaks in the range of $50 billion, but everything began to change starting in 1994.
These fluctuations intensified starting in October 2005—that is, before the Great Recession of 2008—and have been completely out of the ordinary since January 2019, reaching an all-time high in April 2020 of over 1,000 billion dollars in connection with the COVID-19 pandemic!
Document 7:
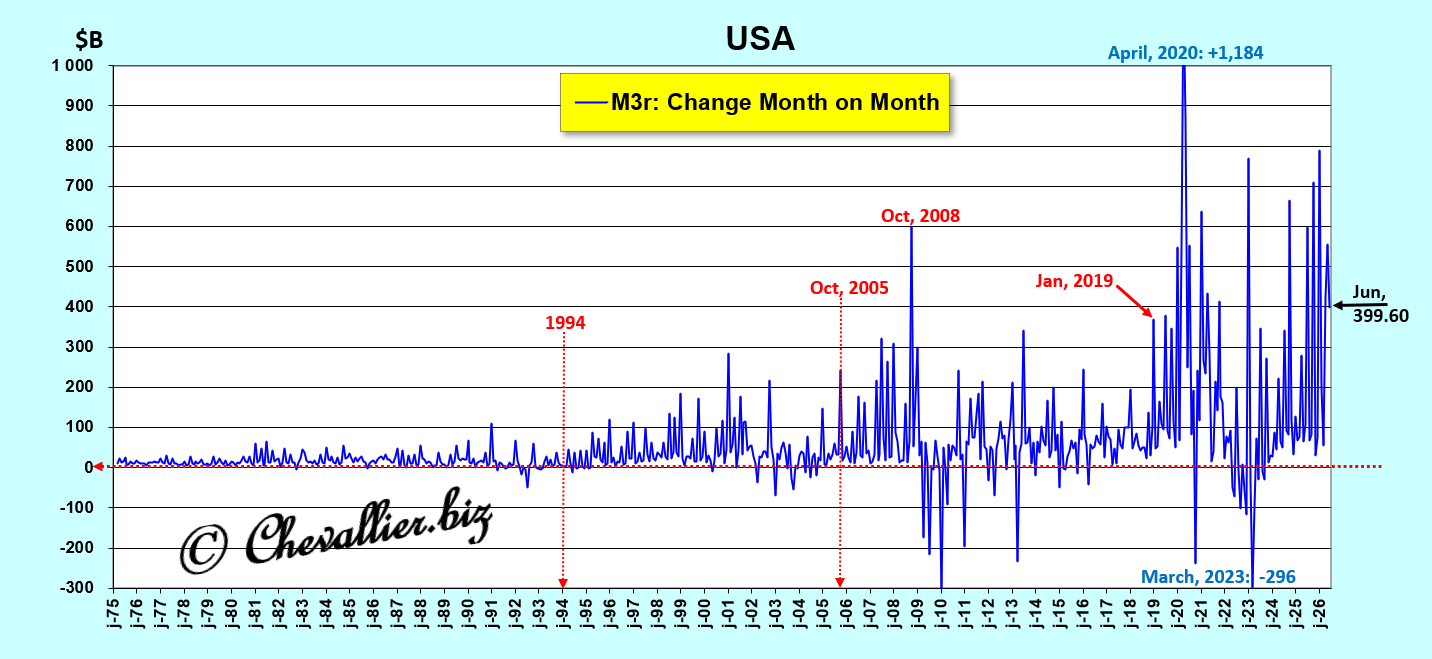
The quarterly peaks in fluctuations of this M3r money supply have skyrocketed since the second half of 2025, which is a prelude to severe financial turbulence similar to that seen before the Great Recession of 2008; however, the crisis now on the horizon will have more serious consequences than those of 2008…
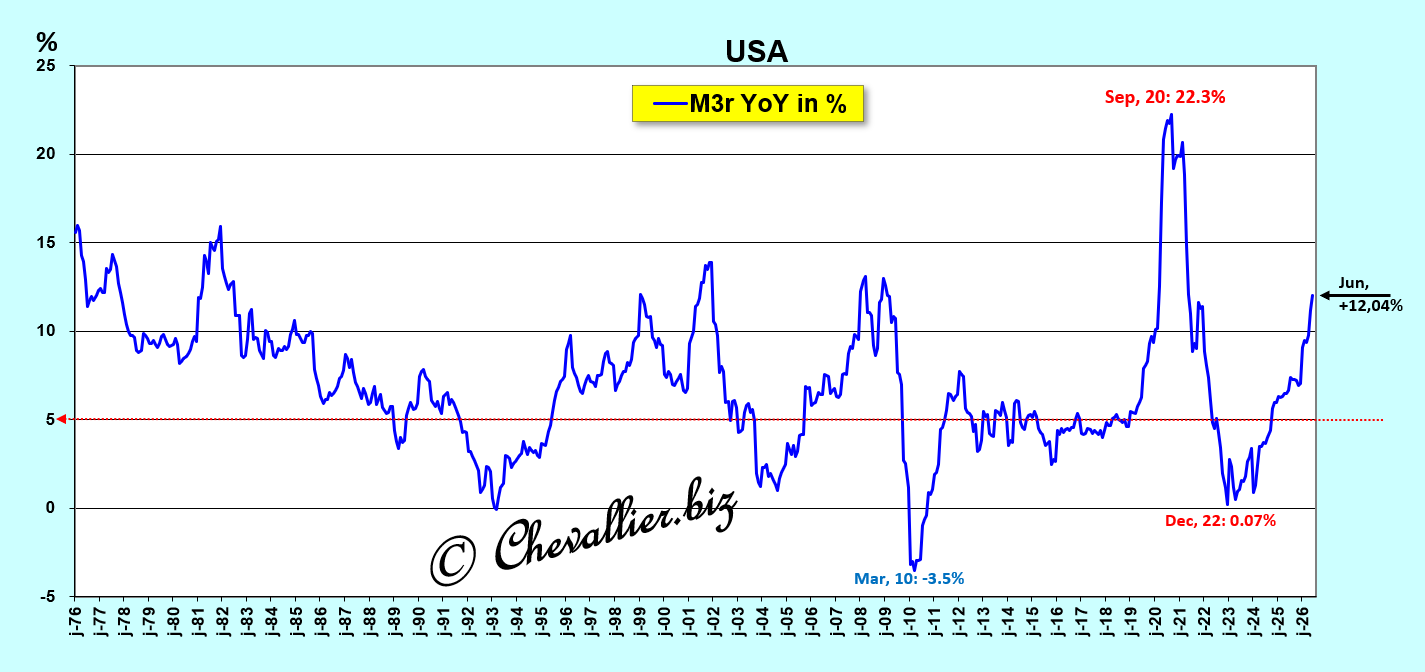
The year-over-year increase in this M3r money supply was… 12.04% (!) in June (the latest figures published to date), which is well above the historical trend of around 5% and the current GDP growth rate of 6.53% in the second quarter of 2026,
Document 8:
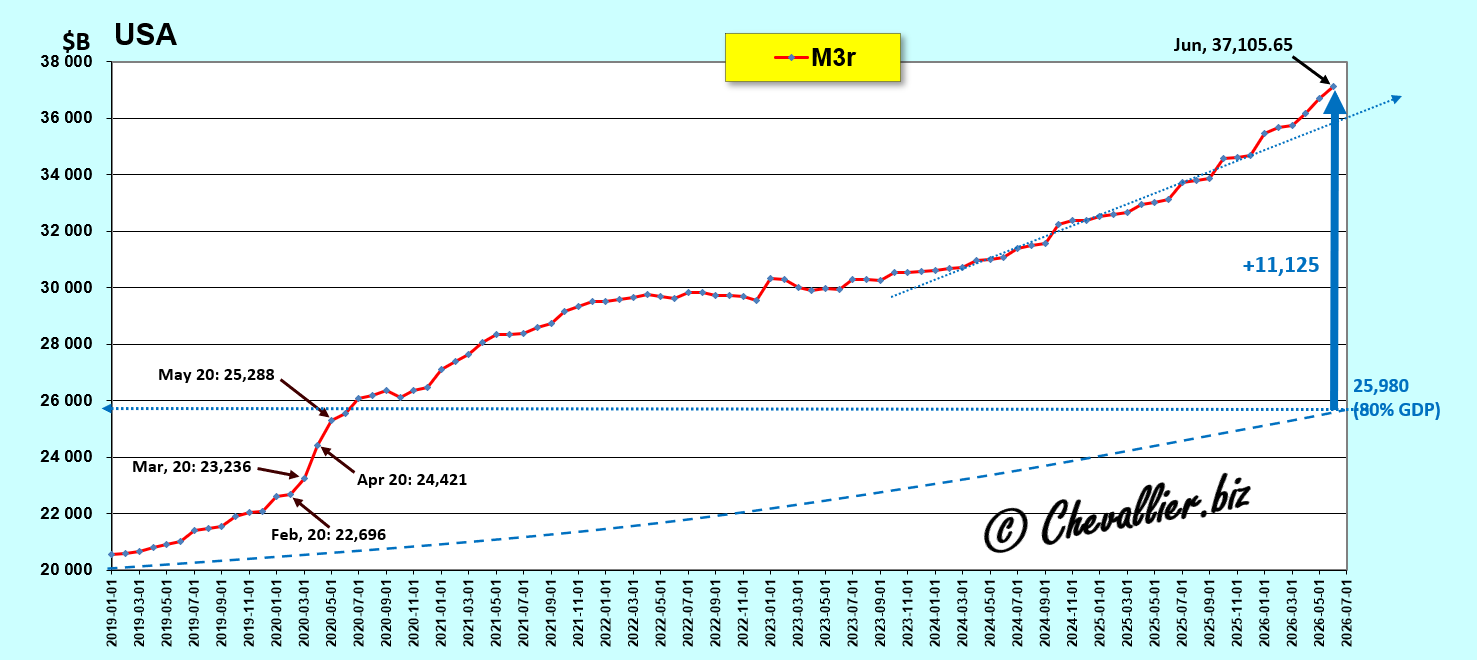
At the end of June 2026, this M3r money supply reached a total of 37,105.65 billion dollars, of which… 11,125 billion dollars are completely out of line with standards (i.e., exceeding the 80% limit of GDP), especially since the COVID pandemic.
Document 9:
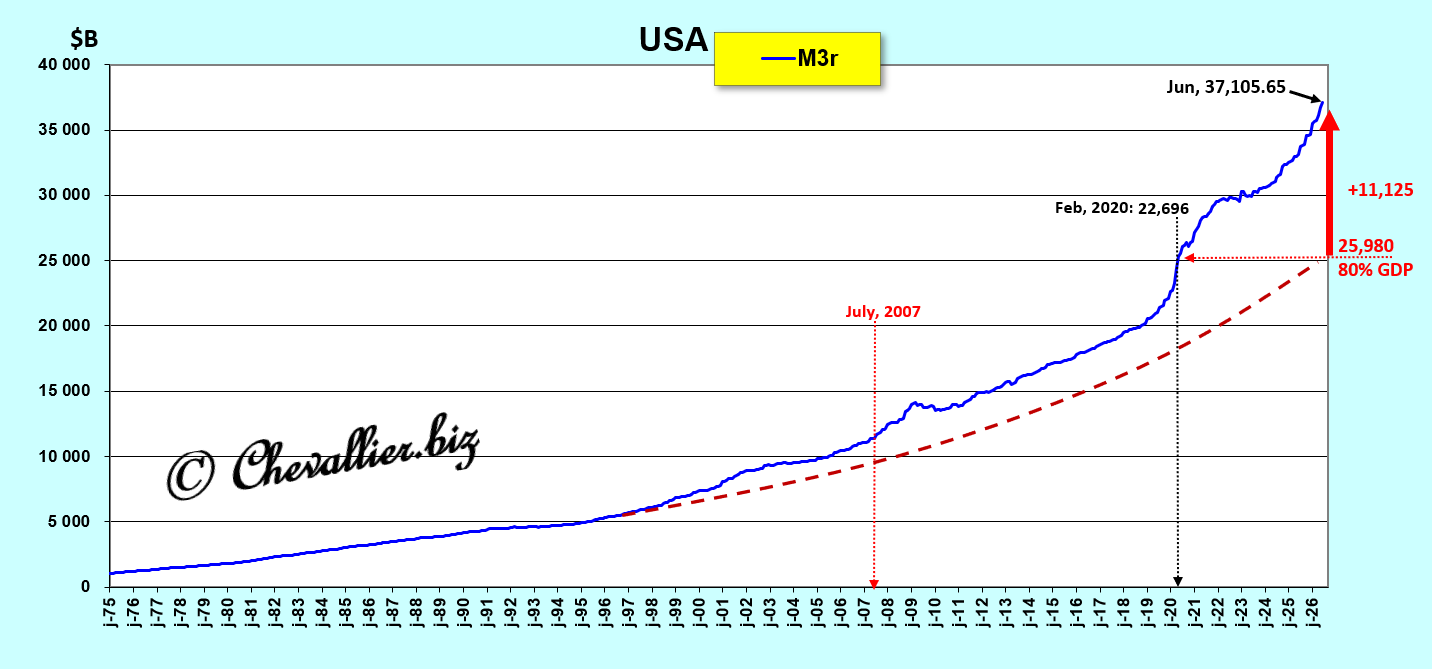
In absolute terms, the M3r money supply should have complied with the standards (shown here as a dotted line), meaning that this total money supply should have remained below 80% of current GDP.
A closer look at the recent period shows that this money supply M3r continues to far exceed its 2020 peak after a period of stagnation from 2022 to 2024.
During the first six months of 2026, this money supply M3r exceeded its long-term upward trend established since the beginning of the second quarter of 2024,
Document 10:
As a reminder, according to standards defined based on observations of changes in monetary aggregates since these data were first published (1959), the level of this M3r money supply should not exceed 80% of current annual GDP.
These standards were more or less adhered to for 50 years but have been significantly exceeded since the Great Recession of 2008.
The M3-to-GDP ratio skyrocketed in 2020 and has not since returned to an acceptable range, continuing to rise to the point of far exceeding 110% of current GDP, with a sharp increase during the first five months of 2026.
Document 11 (identical to Document 1):
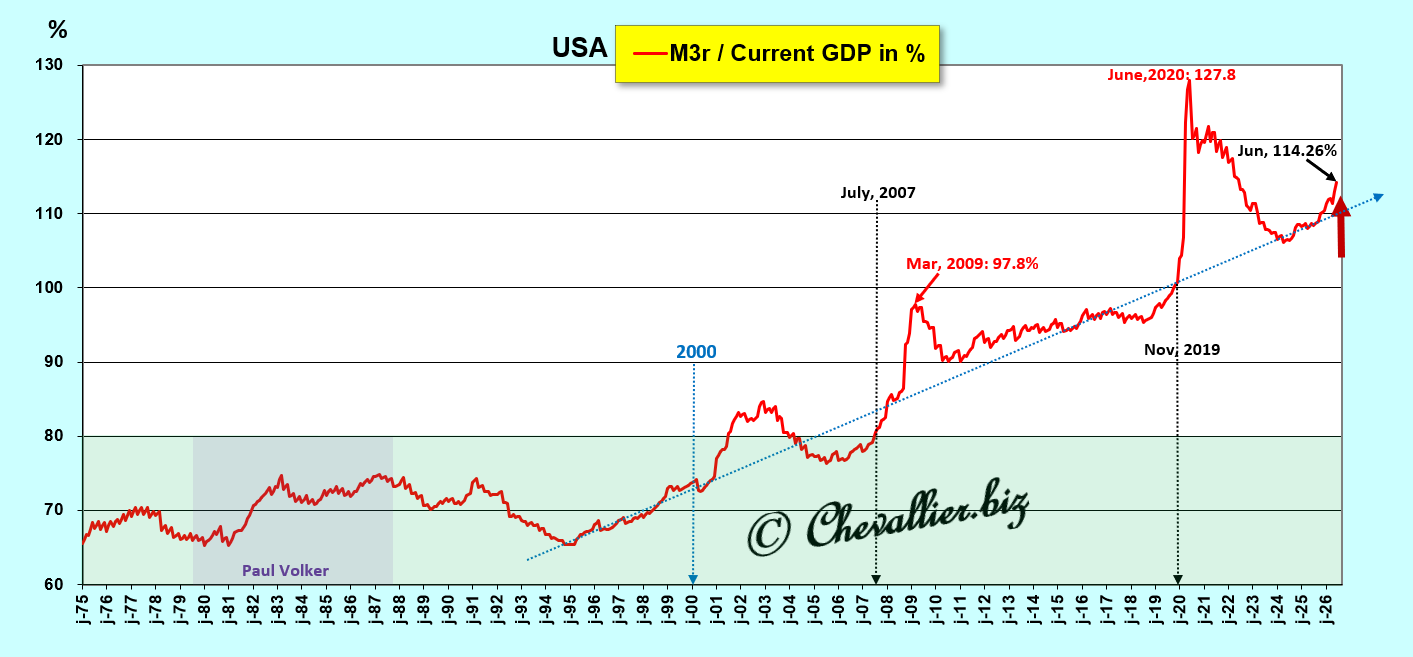
It is this excessive hypertrophy of the M3 money supply that, since the early 2000s and especially since 2007, has been creating these fundamental economic imbalances, which have had—and will continue to have—devastating long-term consequences in the United States and elsewhere in the world.
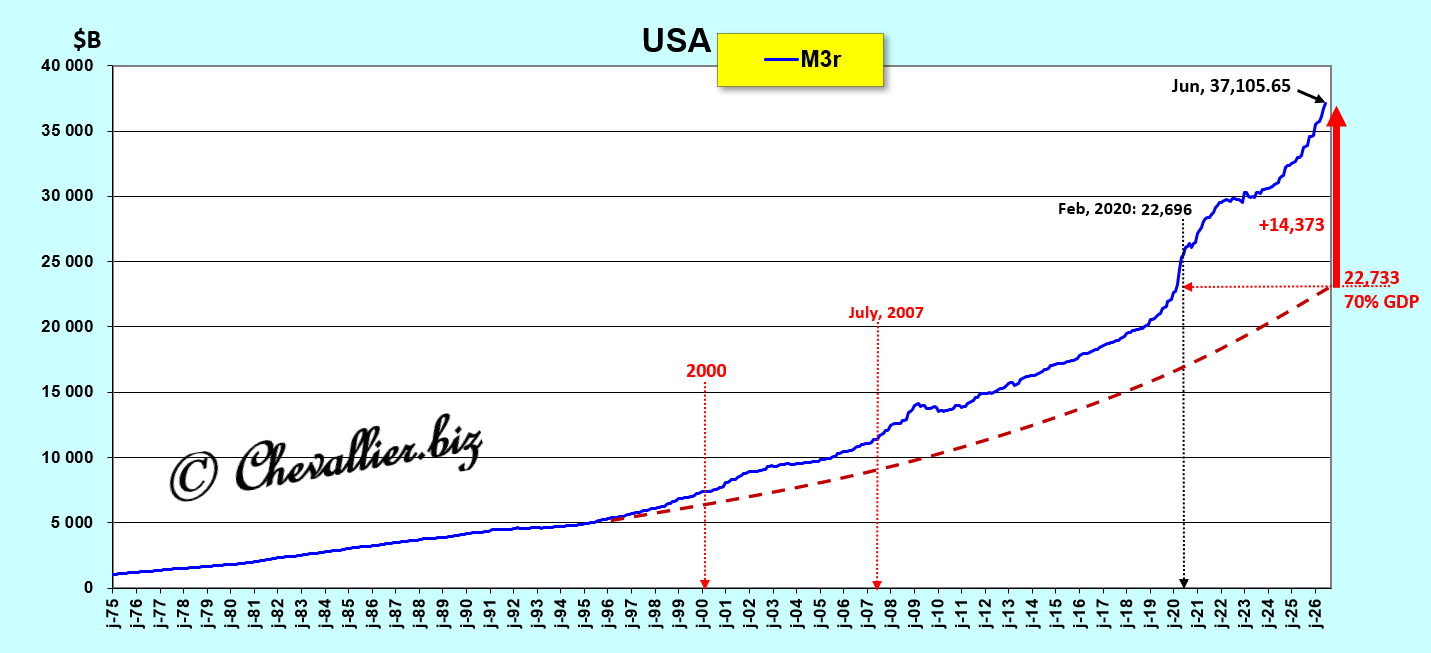
During the second half of the 20th century, FOMC members consistently succeeded in keeping the M3 money supply within an optimal fluctuation band of around 70% of GDP by raising the Fed’s benchmark rate whenever there was a risk of exceeding these limits.
Such measures have no longer produced the expected positive effects since 2008 because this monetary hypertrophy has become far too large.
The U.S. monetary authorities can therefore no longer intervene forcefully to bring this M3/GDP ratio back to around 70% in order to restore a sound currency in the United States, as was the case during the second half of the 20th century.
Thus, the excess of this M3 money supply currently stands at… 14,373 billion dollars, compared to a normal ratio of 70% of GDP!
Document 12:
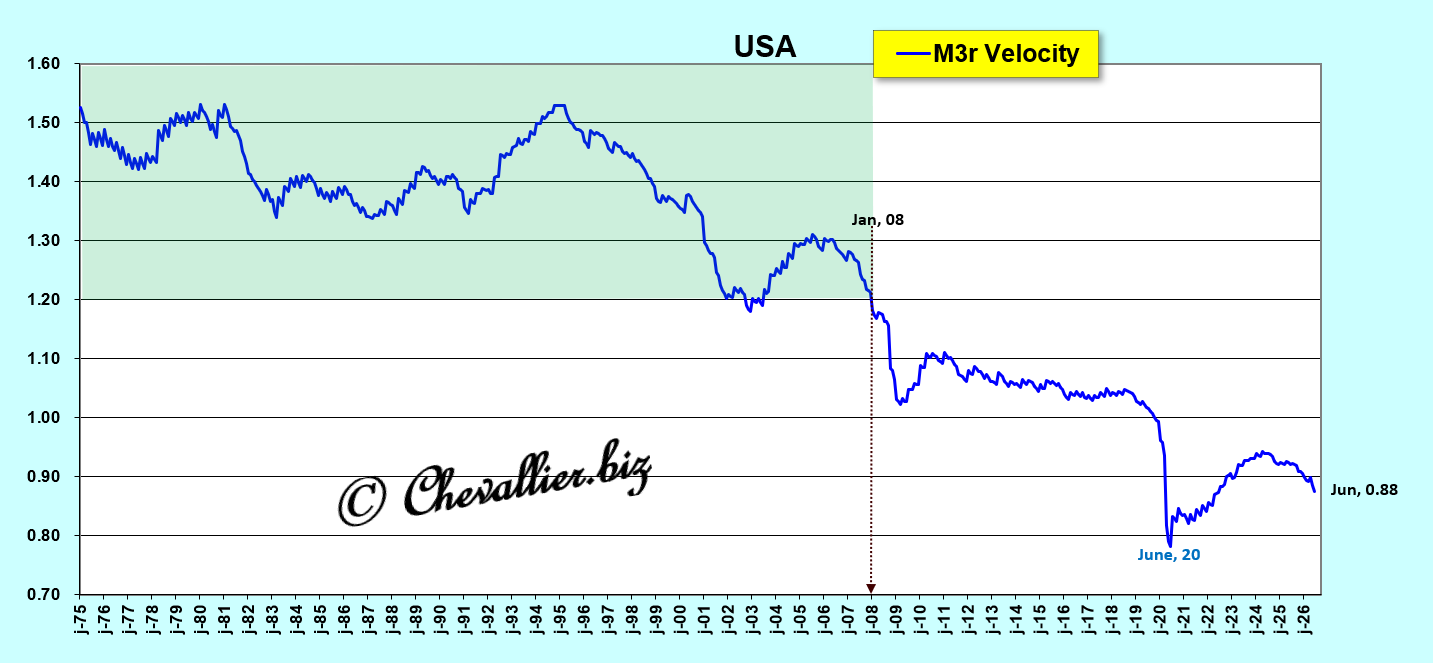
Furthermore, it is possible to analyze these monetary problems from another perspective: based on the velocity of money — which is the GDP/M3 ratio — that is, the inverse of the M3/GDP ratio in percentage terms analyzed previously.
This velocity of circulation of the money supply is a useful educational concept because it helps explain why the faster money circulates, the more growth is stimulated—and vice versa.
For example, when consumers are quick to spend their income and invest, GDP growth is strong. The velocity of circulation is then high—that is, well above 1.
Conversely, when a crisis is anticipated, consumers tend to set money aside (by increasing their so-called precautionary savings) to cope with a foreseeable, uncertain future that generates fear, which causes GDP to slow down. The velocity of money is then low, that is, less than 1.
Document 13:
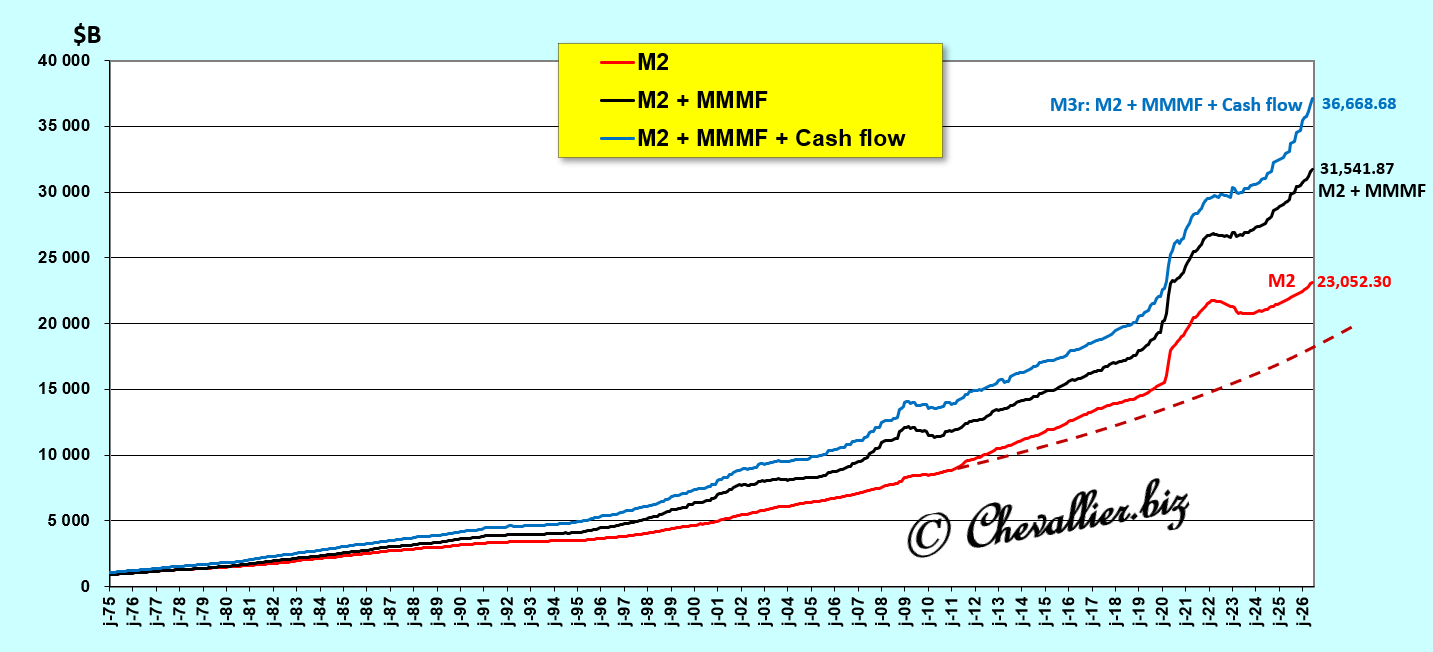
These curves, drawn from statistical series published by U.S. authorities, show that the increase in this excessive expansion of the M3r money supply was driven from 2020 to 2022 by the extraordinary rise in the M2 monetary aggregate, by the rise in money market funds starting in 2019, by the rise in corporate cash flows—especially during the first months of 2026—and by the renewed increase in (precautionary) savings among Americans, that is, in the monetary aggregate M2-M1 due to the war against Iran,
Document 14:
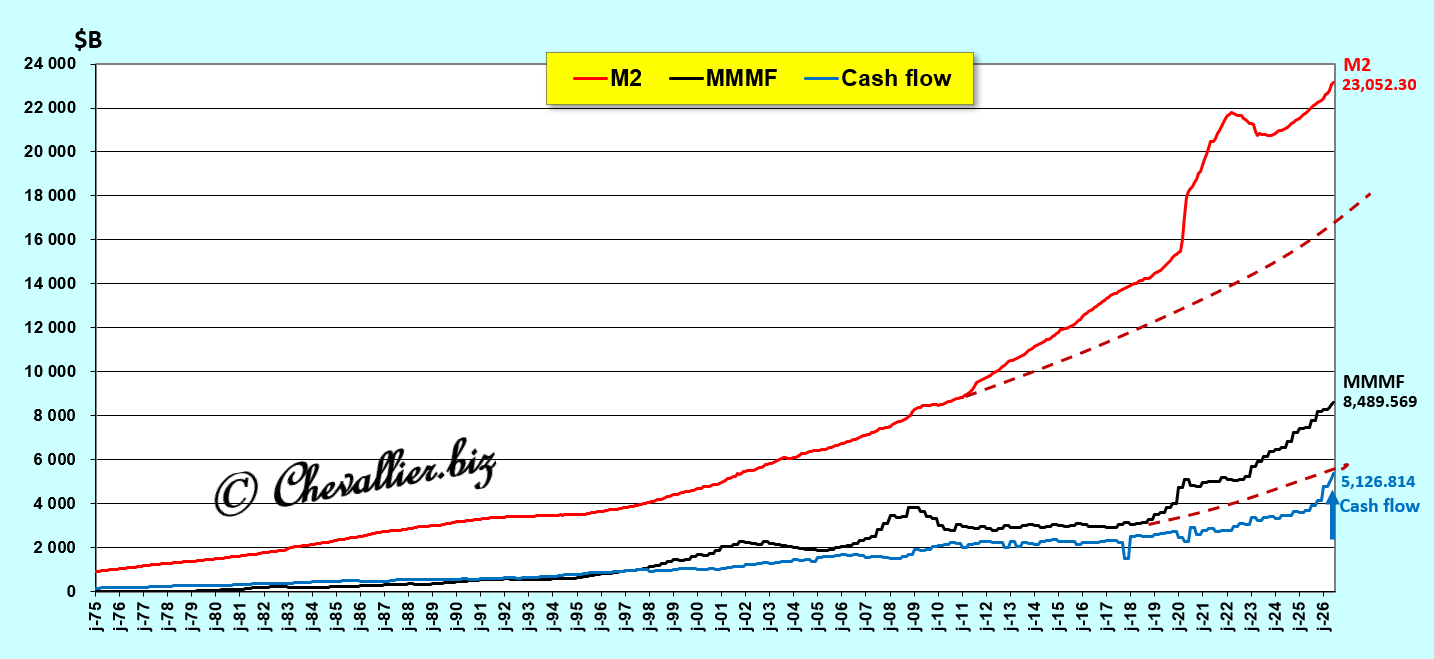
The dashed lines correspond to what would have been the normal trend for these series.
The increases in all components of the total U.S. money supply add up, as evidenced by its increasingly steep slope,
Document 15:
***
Part Two: The Law of the free M3r money supply
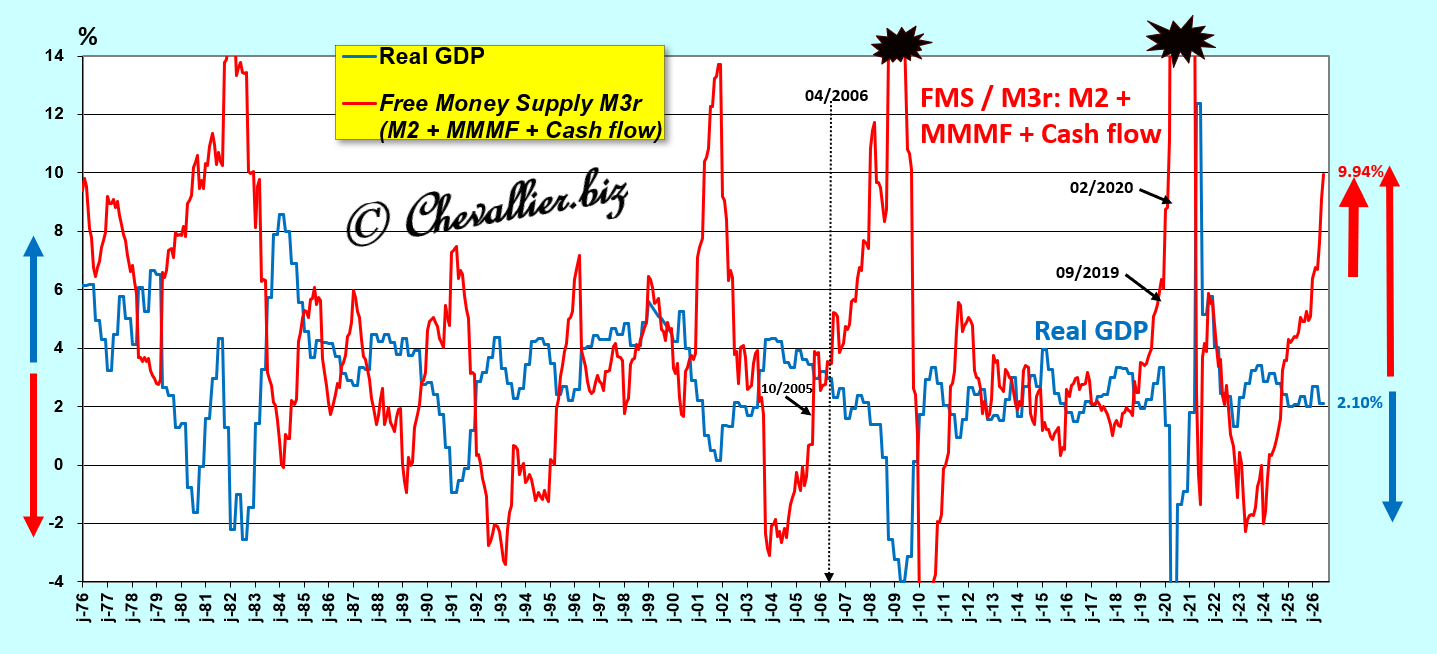
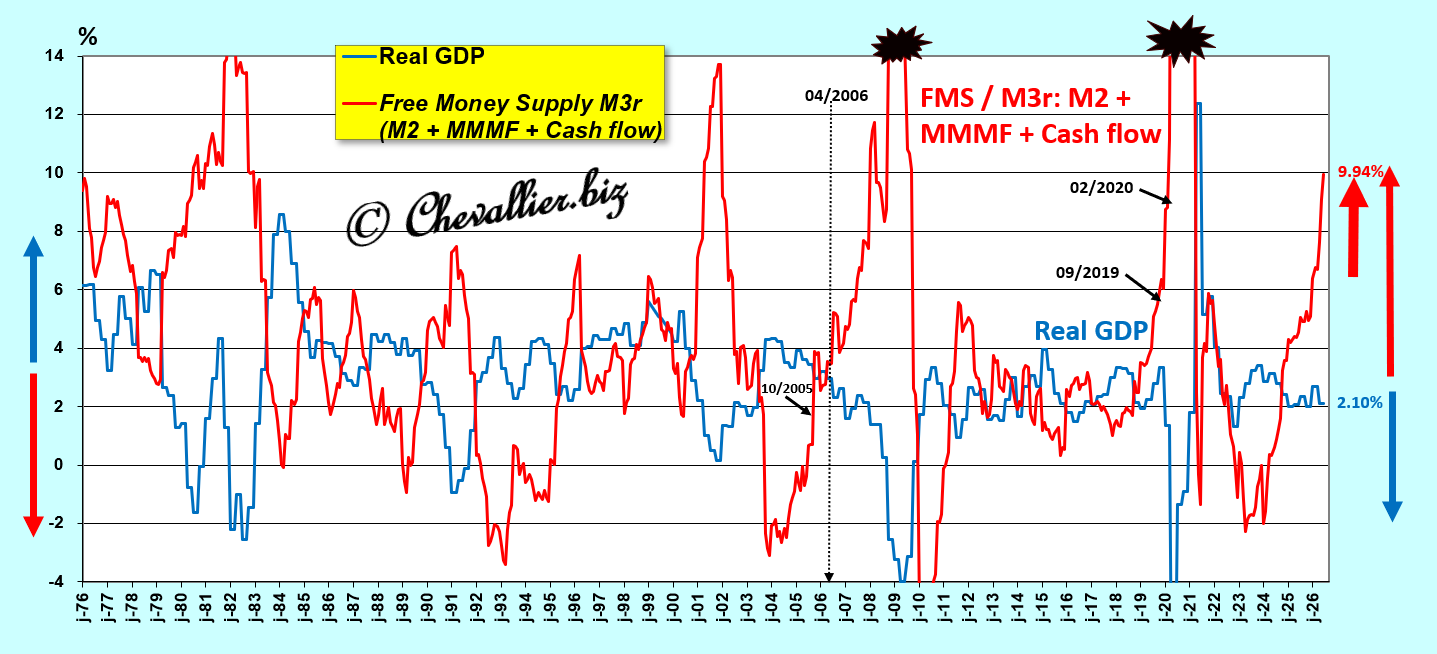
Based on these revised figures for the U.S. money supply M3r, it is quite clear—and to simplify—that an increase in this M3 money supply held by Americans leads to a decline in real GDP, and vice versa, which has held true over the long term, ever since these data have been published by FRED…
More specifically, it is the change in what I call the free money supply M3r—which is the difference between, on the one hand, the change (year-over-year in percentage terms) in the money supply M3r, and on the other hand (minus) the change in real GDP (year-over-year in percentage terms)—that causes an inverse reaction in real GDP.
Document 16 (identical to Document 2):
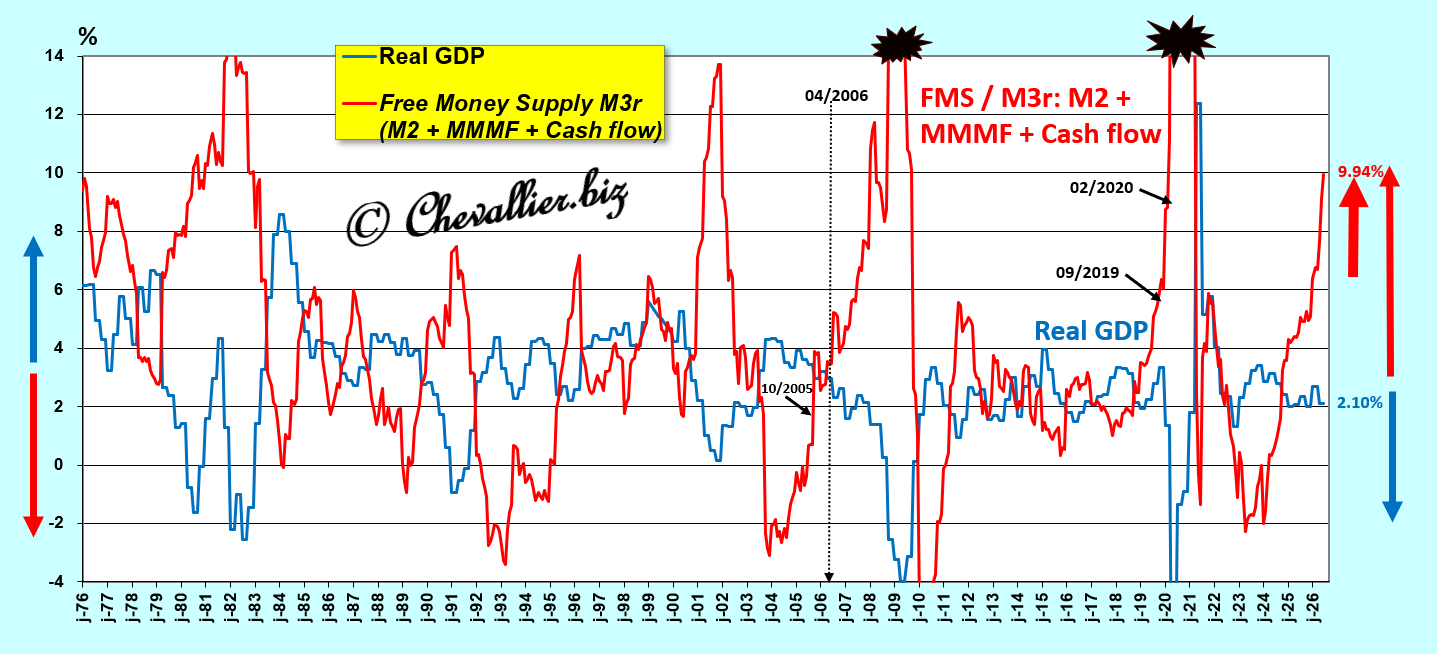
However, paradoxically and exceptionally, this law has not held true since the first quarter of 2025.
In fact, this free money supply M3r (Free Money Supply, denoted FMS / M3r) has increased by… 9.94%, and real GDP has also risen by 2.10% (year-over-year percentage change in both cases), whereas normally, this sharp increase in the M3r money supply should have caused a decline in real GDP—which did not occur for two reasons…
On the one hand, the excessive growth of the M3r money supply (which corresponds to 114% of GDP; see Document 11 above) has become so significant that it is beginning to create an unmanageable situation manifested by irrational market exuberance—a phenomenon that will be short-lived and followed by a major crisis, a momentum crash.
On the other hand, an article by ZeroHedge showed that three-quarters of the GDP growth in the first quarter of 2026 was driven by extraordinary investments in artificial intelligence—which constitutes a new bubble within the already oversized monetary bubble that worsened further in the second quarter of 2026!
Click here to read this ZeroHedge article.
Consequently, based on the figures published to date, the United States is in a situation of deeply entrenched monetary hypertrophy that has not occurred in the past 50 years, aside from the peak linked to the so-called COVID period, which was therefore temporary—unlike the current situation.
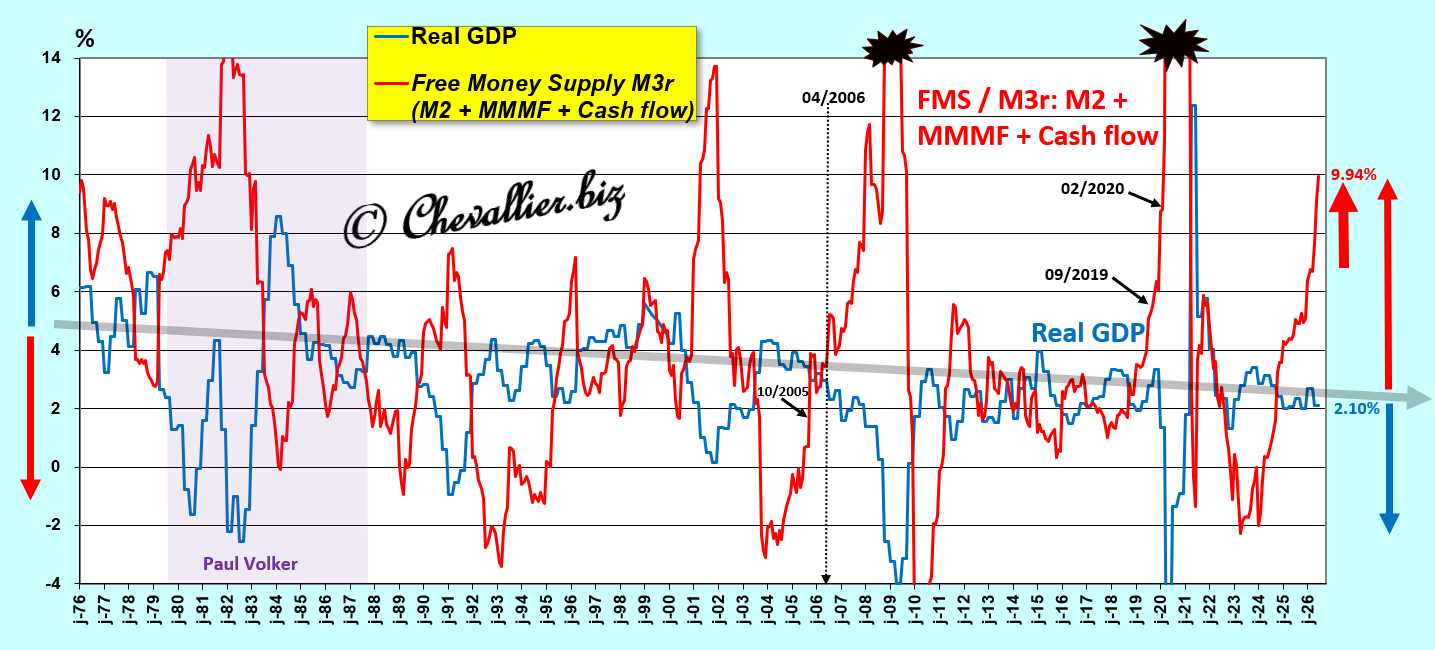
Regardless of this currently completely extraordinary situation, this law regarding the free money supply M3r is well established, as shown by the arithmetic trend lines of the changes in the free money supply M3r and real GDP, which are nearly parallel (though slightly converging and declining), falling from approximately 5.5% and 4.0% in 1976 to 3.0% and 2.0%, respectively, at the end of last June,
Document 17:
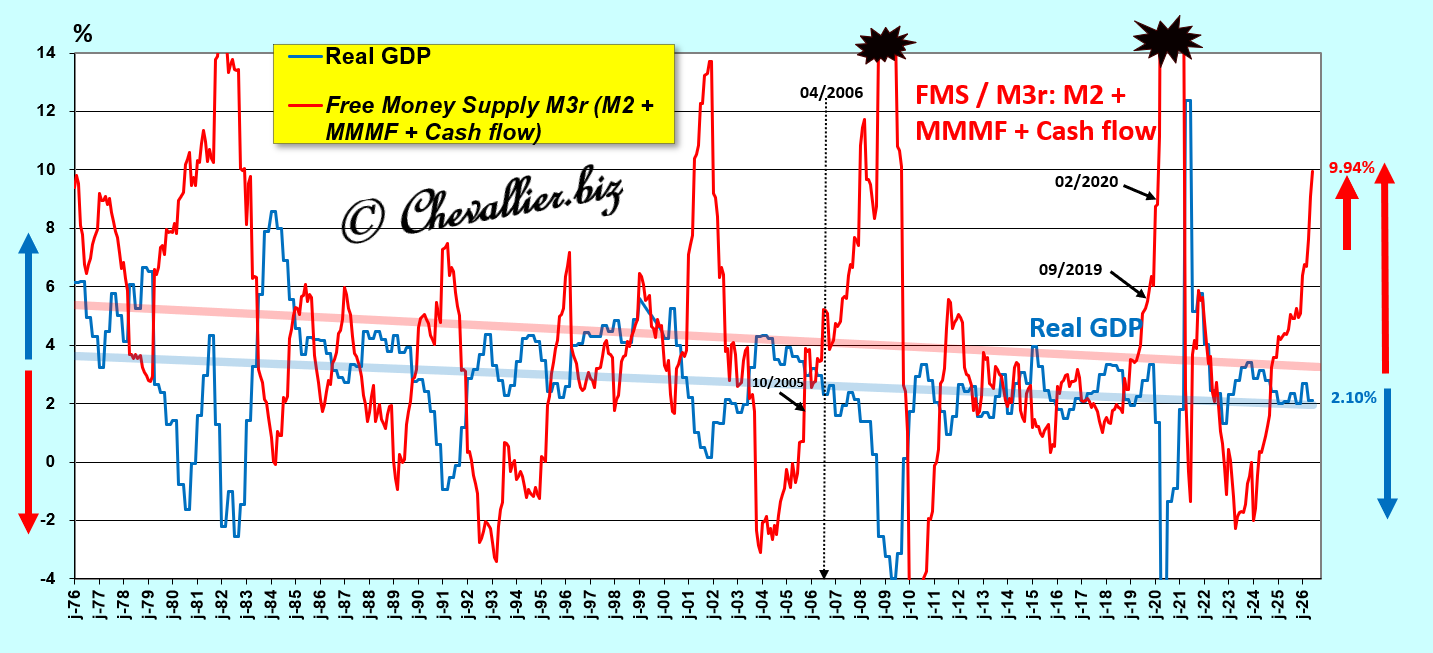
The line acting as an axis of symmetry between these curves declines from approximately 5.0% to 2.5% over this long 50-year period, which shows, among other things, that Paul Volcker managed the Fed’s monetary policy particularly well to keep the U.S. monetary system sound during this period of severe financial turbulence—a situation that has not been the case since the early 2000s!
Document 18:
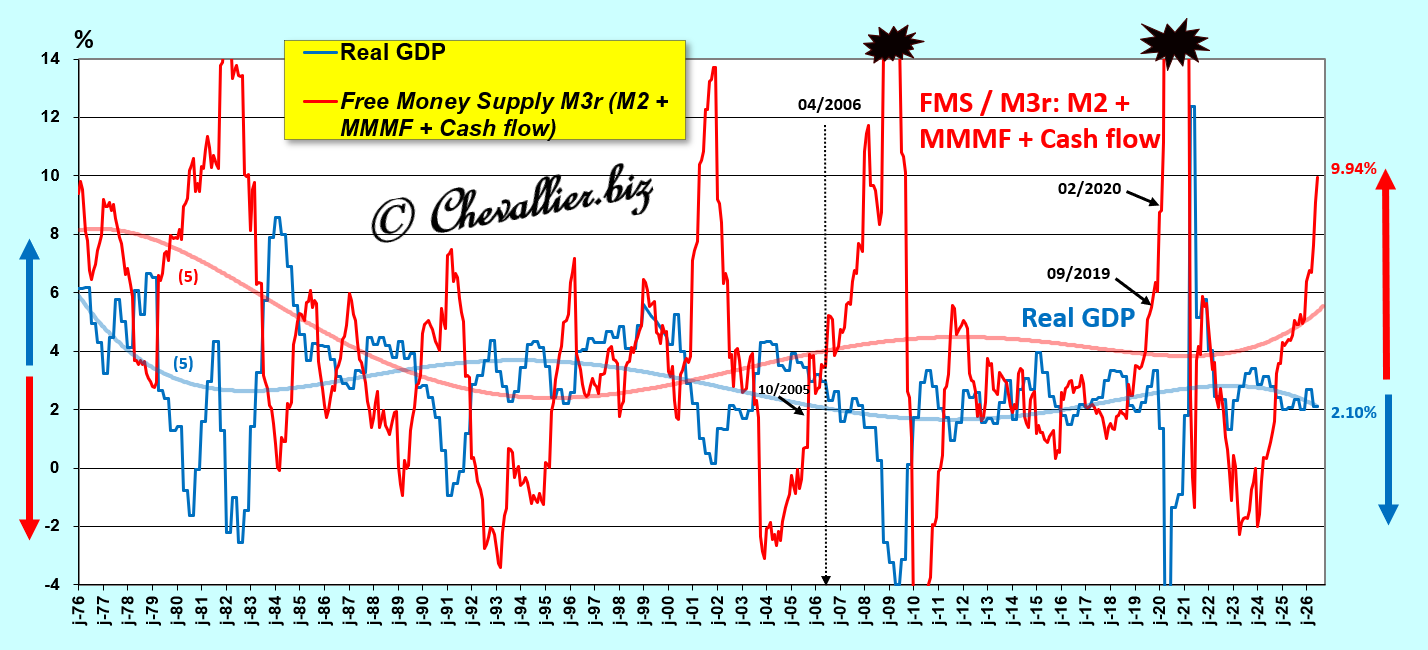
The 5th-order polynomial trend curves clearly highlight the alternating and opposing variations in the data from these series over the long term.
Document 19:
A closer look at the recent period since the early 2000s confirms that changes in the free money supply M3r continue to generate inverse changes in real GDP, as before… except since the first quarter of 2025!
Document 20:
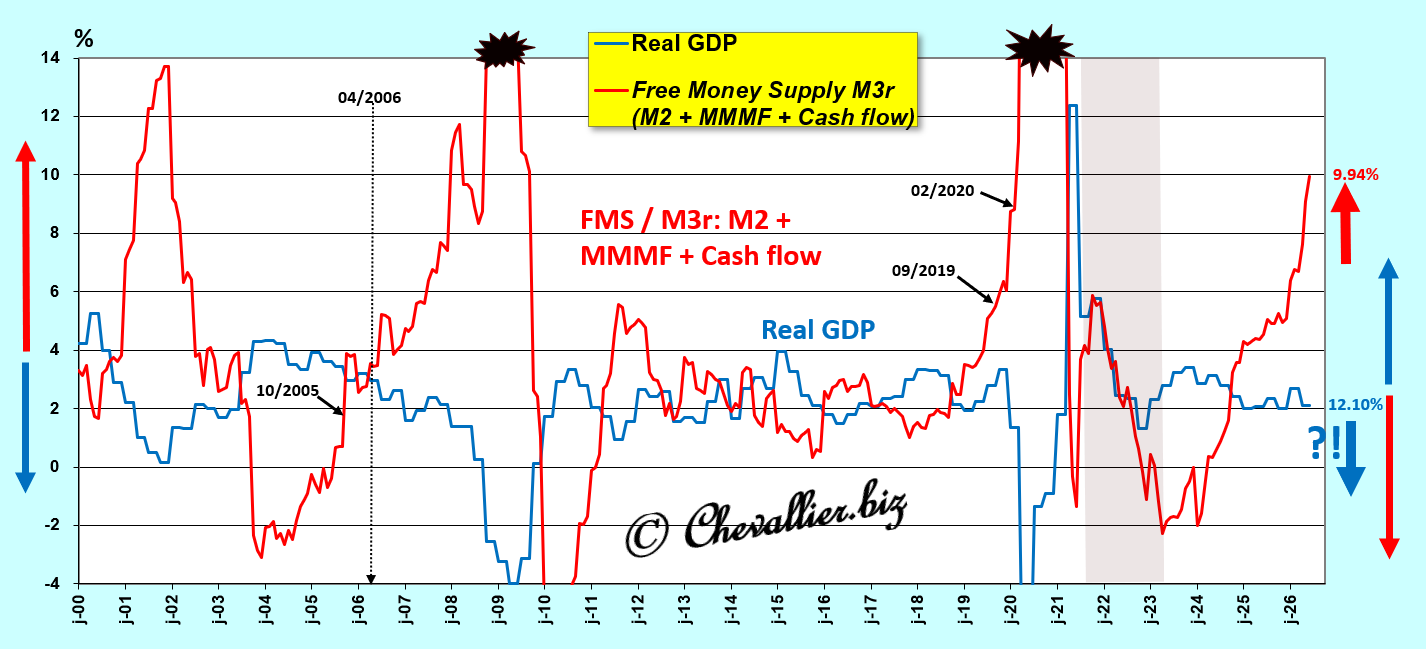
The arithmetic trend lines for changes in the free money supply M3r and real GDP are nearly parallel (though very slightly converging, and upward-sloping for GDP) and flat (horizontal), at around 4% and 2% over this recent period spanning the first quarter of the 21st century.
The decline in real GDP that began in early 2024 should have continued through to the present, as indicated by the dotted line.
Document 21:
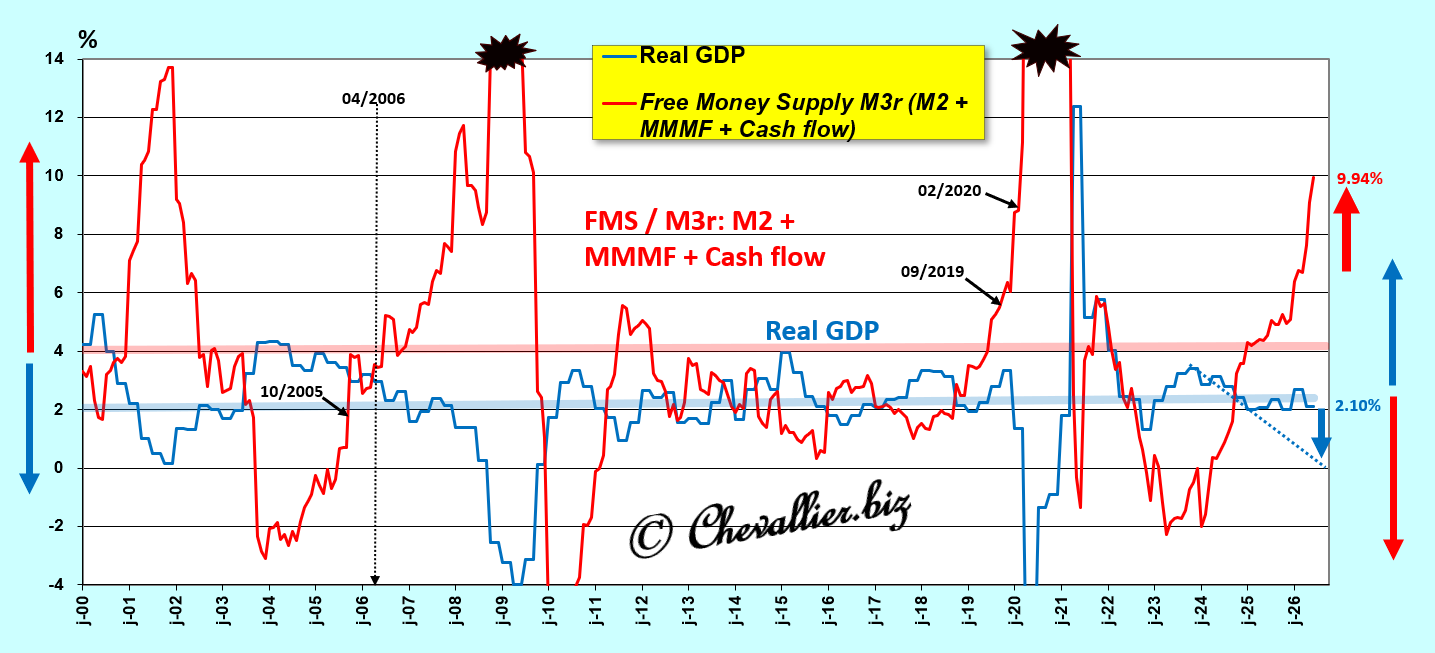
Logically, the line serving as the axis of symmetry between these curves remains virtually stable at 3.0% over this period—the first quarter of the 21st century—which confirms the significance of this free money supply M3r!
Document 22:
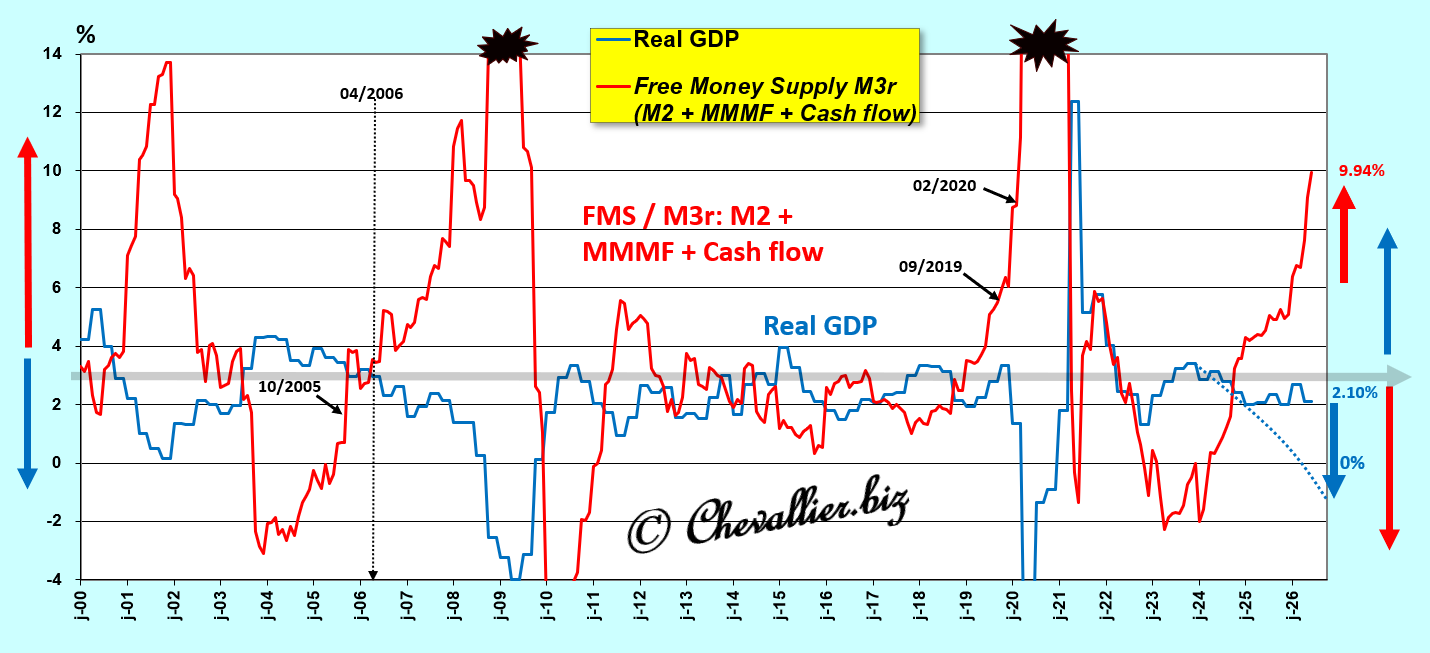
Normally—that is, independent of overinvestment related to artificial intelligence and extraordinary monetary expansion—real GDP should have plunged into negative territory, as indicated by the dotted curve.
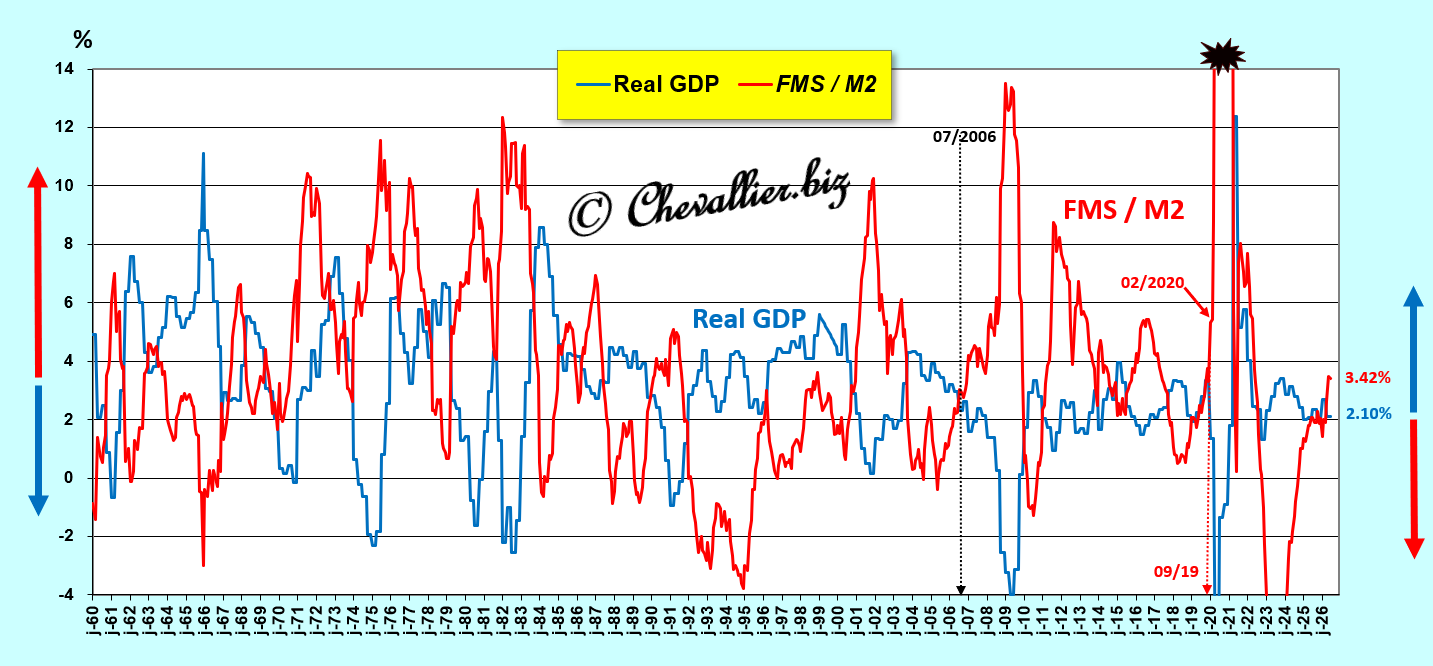
This law regarding the free money supply M3r—calculated based on the total money supply of the United States—is also valid for figures pertaining solely to the monetary aggregate M2 over the long period from 1960 to the present, according to figures published monthly by the Fed; see my previous article on this subject,
Document 23:
The same holds true for the more recent period beginning in 2000, except for the period starting in the first quarter of 2025, as the worsening of monetary hypertrophy is caused by the increase in deposits in money market funds and by exceptionally high corporate cash flows, that is, by components of the M3-M2 monetary aggregate alone, whereas the growth of the M2 monetary aggregate was slightly lower than current GDP growth in the first quarter of 2026, but this M2 monetary aggregate grew very rapidly thereafter.
Document 24:
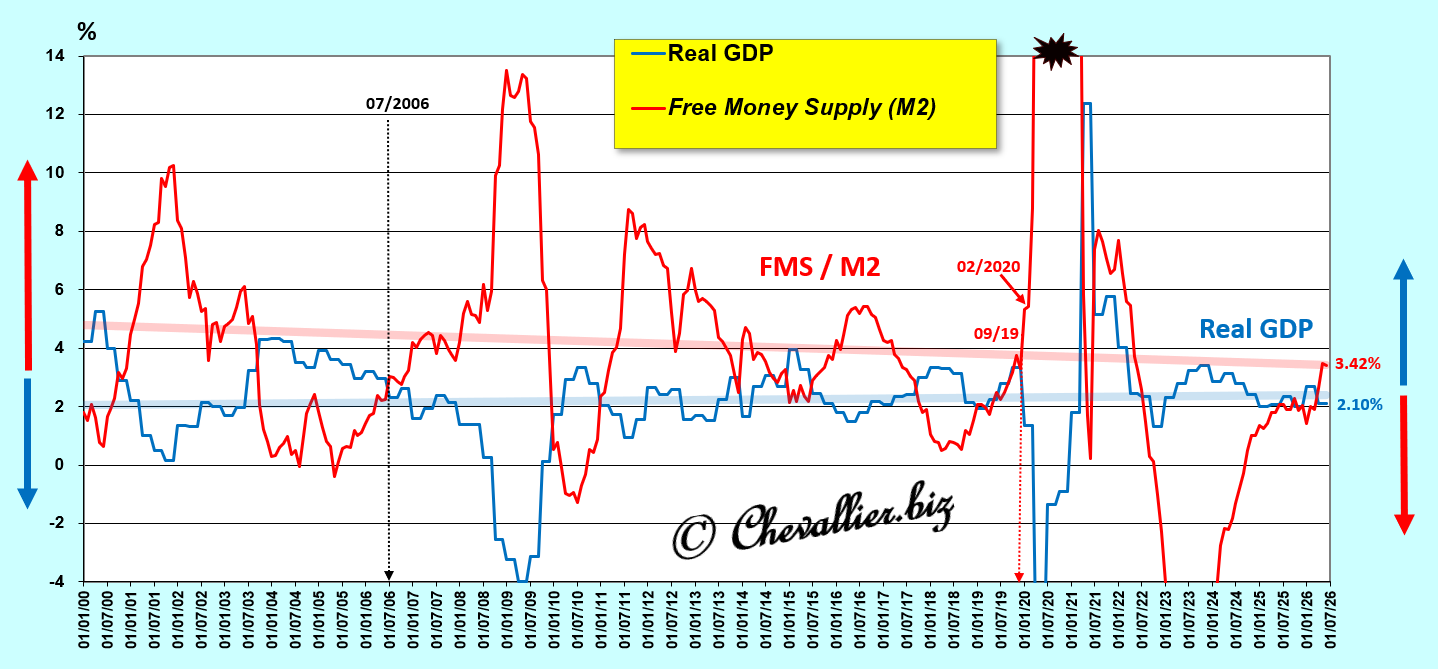
This law regarding the free money supply M3r, calculated based on the total U.S. money supply, is therefore equally valid with respect to figures pertaining solely to the M2 monetary aggregate over the long period up to the end of 2025, according to official figures published monthly by the Fed.
However, the figures for the M2 monetary aggregate alone do not clearly highlight the significant deterioration in the U.S. monetary situation at the beginning of 2026.
This is why it is essential to rely on the reconstructed M3 money supply to provide the most accurate picture possible of the current state of the U.S. economy.
The fluctuations observed in the overall M3r money supply are more pronounced and occur earlier than those based solely on M2 figures.
Document 25:
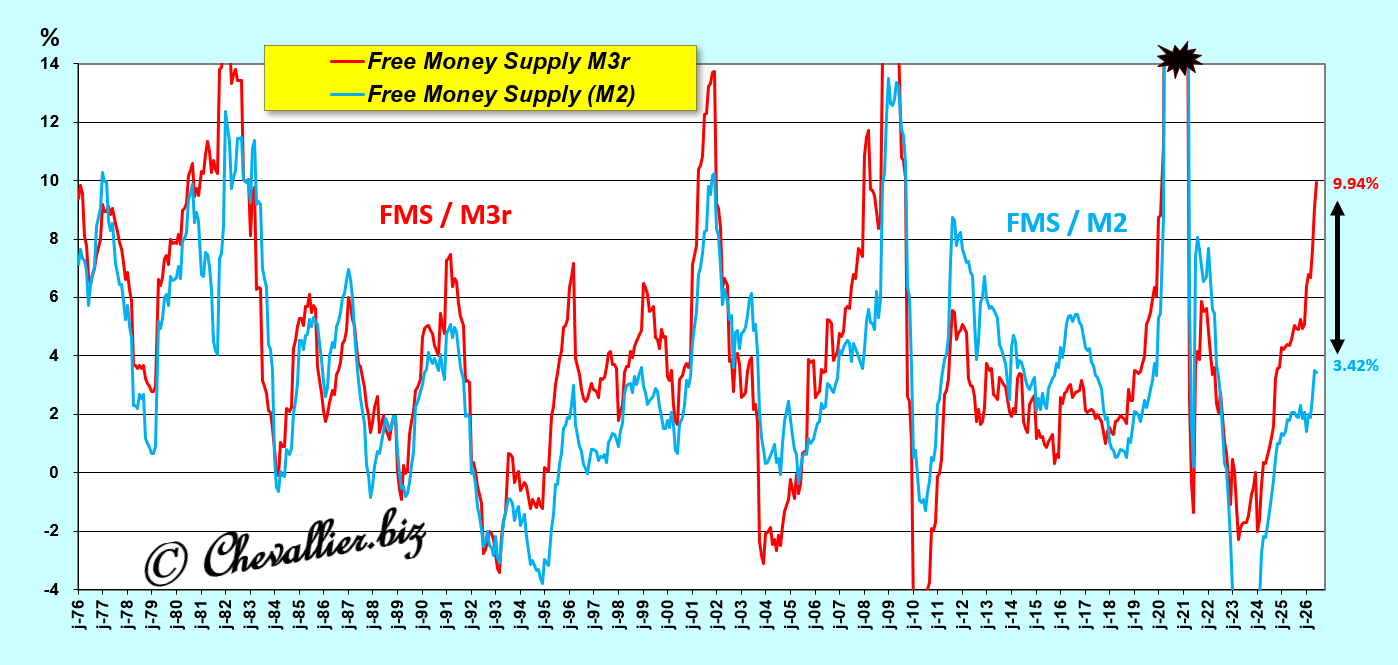
The gap between these two series for the first six months of 2026 has never been this wide since these data have been published!
It is therefore preferable to use the data derived from the redefined M3r money supply (rather than M2) for analysis, as this provides the most accurate picture possible of the expected trend in real GDP growth.
***
The Pearson correlation coefficient between the trend in U.S. real GDP and what I define as the free money supply M3r is -0.78 for the period from January 2000 to March 2021, which corresponds to a very strong inverse correlation—that is, a significant relationship that, under such circumstances, is a cause-and-effect relationship.
Thus, to put it simply, it is clearly confirmed that when the free money supply M3r increases, U.S. real GDP decreases, and vice versa.
This Pearson correlation coefficient is -0.62 for the long period beginning in July 1976 and extending through March 2021.
However, the period marked by the COVID-19 pandemic has completely and permanently disrupted the fundamental economic balances of America and most countries around the world, which explains the decline in this Pearson coefficient after March 2021.
Nevertheless, this Pearson correlation coefficient improves to -0.82 for the period beginning in April 2023—that is, after the major turbulence of the COVID-19 period—through the end of 2025, thus excluding the first three months of 2026, which are anomalous.
***
Analyses and conclusions regarding the impact of changes in monetary aggregates on real GDP have not been taken into account by financial market participants for the past twenty years or so, even though these are the solutions to problems that underlie the economic activity of any nation.
This is precisely why Ben Bernanke took steps to ensure that the Fed would no longer publish weekly figures for the M1, M2, and M3 monetary aggregates once he assumed the role of chairman of the Fed in February 2006.
Subsequently, Jerome Powell added another layer of opacity by publishing only monthly data for the M2 monetary aggregate.
Only those working within the Fed have access to this fundamental data, allowing them to manipulate financial communications and financial markets as they see fit!
However, I have managed to reconstruct the amount of the U.S. M3 money supply—denoted as M3r for revised—based on the components that make up the M3-M2 aggregate, which are still published elsewhere; see my previous articles on this subject.
Arthur Laffer’s maxim, “sound money is the first pillar of Reaganomics” is now nothing more than a distant memory of a bygone era…
***
Conclusion and Solutions
One solution to restore America’s fundamentals and bring back sound money would be to create a major global economic crisis by bursting the monetary bubbles—particularly in the United States…
And this is precisely what is happening with this war against Iran, which now appears to be the root cause—one that has been obscured by those who manipulate public opinion and the financial markets…
***
The Problem of Petrodollars
Everyone agrees that petrodollars are an excellent means for U.S. leaders to subjugate the leaders of other countries—competitors, adversaries, and potential enemies.
However, the volume of these petrodollars has become so vast that it contributes to the creation of this excessive expansion of the U.S. money supply to the point of having lethal consequences.
In fact, according to a reliable assessment by the Bank for International Settlements (BIS), the volume of these eurodollars is estimated to have been in the range of 14,000 billion dollars in 2025.
Document 26:

One currently feasible solution to burst part of this monetary bubble would be to drastically reduce the volume of Eurodollars—and more specifically, that of petrodollars.
Thus, contrary to widely held beliefs in political and economic circles, the massive use of the U.S. dollar (USD) outside the United States to monitor and sanction America’s alleged adversaries does not ultimately yield the expected benefits, especially when weighed against the drawbacks caused by this monetary bloat.
It would be possible to implement such a policy by no longer requiring the rest of the world to use the U.S. dollar in international transactions not involving Americans, particularly in the hydrocarbon markets.
The militarization of the dollar and international relations does not restore America’s greatness; conversely—and paradoxically—it is America’s return to the fundamentals of liberal capitalism that would allow the MAGA slogan to be put into practice… and that is exactly what the leaders of… Communist China are successfully doing!
***
E pur si muove
***
The data on money market mutual funds (MMMF) are those coded as MMMFFAQ027S by FRED.
Click here to access them.
These data, as well as those on corporate cash holdings for the second quarter of 2026, are assessed in the same way as their changes compared to the previous quarter.
Click here to read the BIS document estimating the amount of Eurodollars.
Click here to read my previous article on this topic.
Click here to read this article on my website in French.
© Chevallier.biz