

The hypertrophy of the M2 monetary aggregate in the United States is considerable: more than $5 trillion of unearned money was still unduly in the accounts of Americans at the end of June 2025… This is unmanageable and lethal!
***
I am revisiting my previous article following the publication of US GDP figures for the second quarter, which show strong growth of 1.99%, whereas I had anticipated a weaker increase of 1.11% for real GDP year-on-year…
These are the only minor changes I am making to my previous article on this subject. They only affect documents 2, 3 and 4.
***
As a reminder, sound money is the first pillar of Reaganomics, according to Arthur Laffer, which means that the ratios of monetary aggregates to current annual GDP (as a percentage) must not exceed certain limits derived from observing their evolution since the post-war period in the United States.
As a reminder, the total money supply of a nation, denoted M3, is the sum of three monetary aggregates…
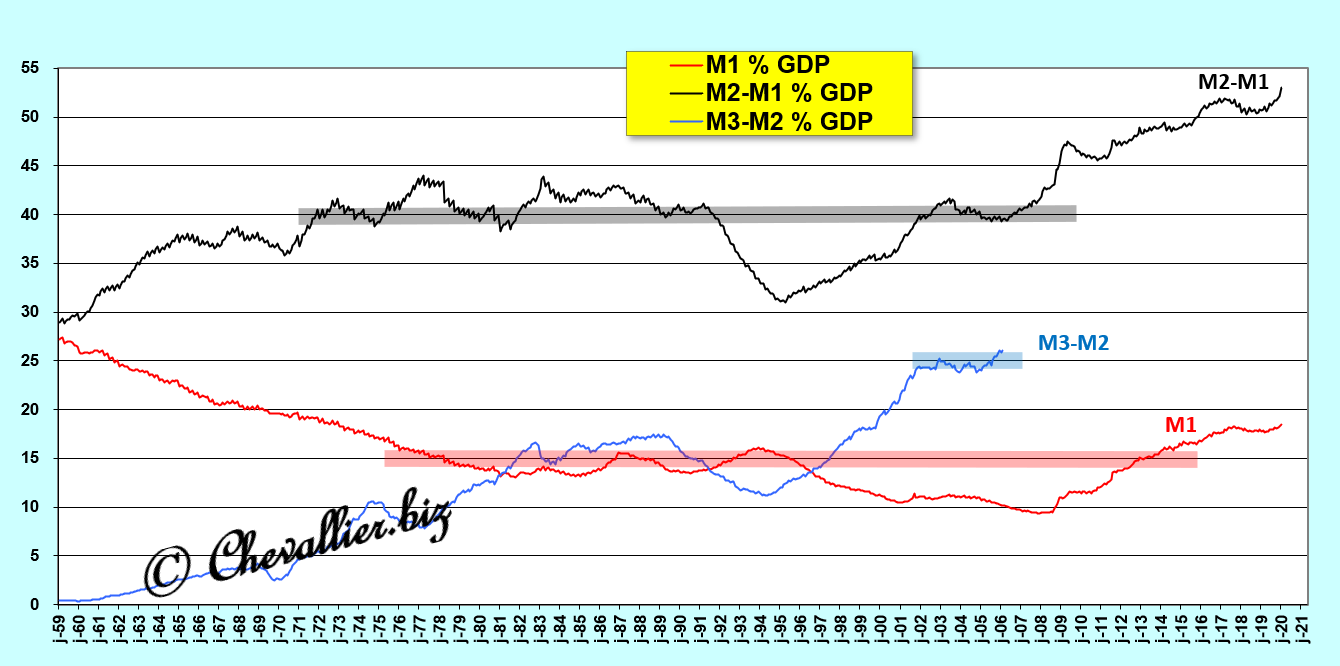
The monetary aggregate M1 is the sum of the positive balances of current accounts and banknotes, and the M1/GDP ratio (as a percentage) must not exceed 15% of GDP.
The M2 monetary aggregate consists of the sum of the M1 aggregates and the M2-M1 aggregate, which includes deposits in savings accounts. It must be less than 40% of GDP.
Finally, the M3-M2 aggregate corresponds to the total cash holdings of companies and their equivalent in money market funds. It must represent less than 25% of GDP.
Document 1:
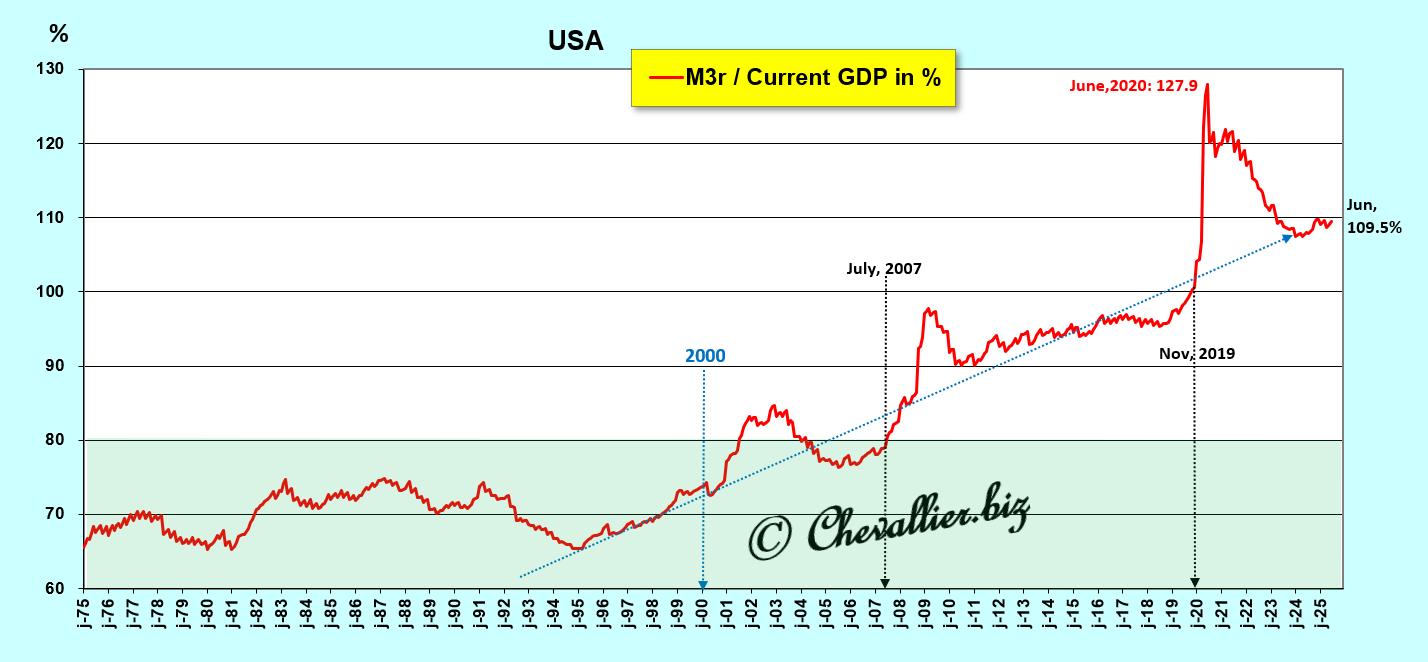
Thus, the total money supply M3 of a nation must not exceed 80% of GDP.
However, this M3/GDP ratio has been exceeded since the end of July 2007, with a historic peak of over 120% at the end of June 2020, because the authorities then banned Americans from working while giving them more than $6 trillion so that they could continue to live normally, which was a historic mistake (and manipulation of public opinion), obviously.
This M3/GDP ratio reached 109.5% at the end of June, according to the latest figures published to date.
Document 2:
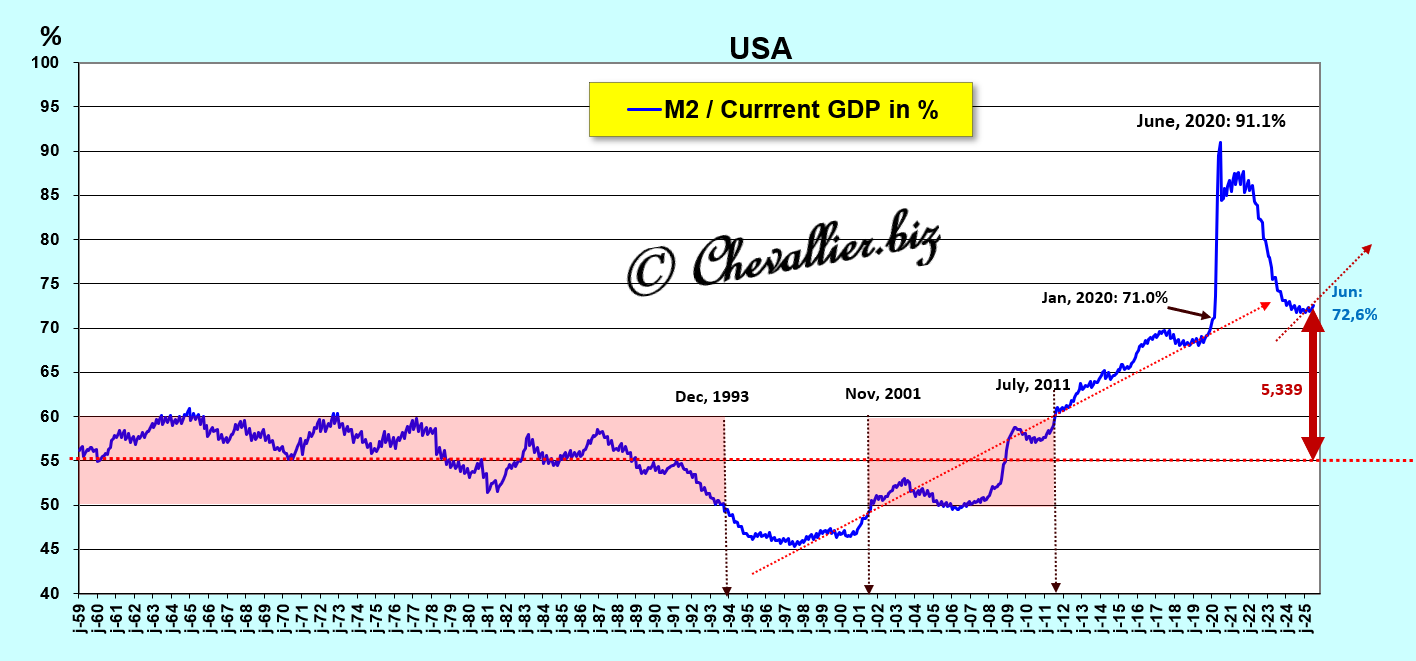
Small problem: the Fed has not published M3 money supply figures since Ben Bernanke became chairman in early February 2006, but I have managed to reconstruct them, represented here by M3r with an r for reconstructed, see my articles on this subject.
Only M2 data are published monthly. The evolution of the M2/GDP ratio shows strong similarities with the M3r ratio in Document 2 above.
Thus, the main reliable standard that can currently be used is as follows: the M2 monetary aggregate must not exceed 55% of current annual GDP… but this ratio stood at… 72.6% of GDP at the end of June, the latest figures published to date!
Document 3:
A new event occurred in the first quarter of 2025: the two ratios, M3r/GDP and M2/GDP, diverged…
The ratio of total money supply M3r to current GDP has been stagnating since the beginning of 2025, while its counterpart, the M2 monetary aggregate, has continued to increase.
Document 4:
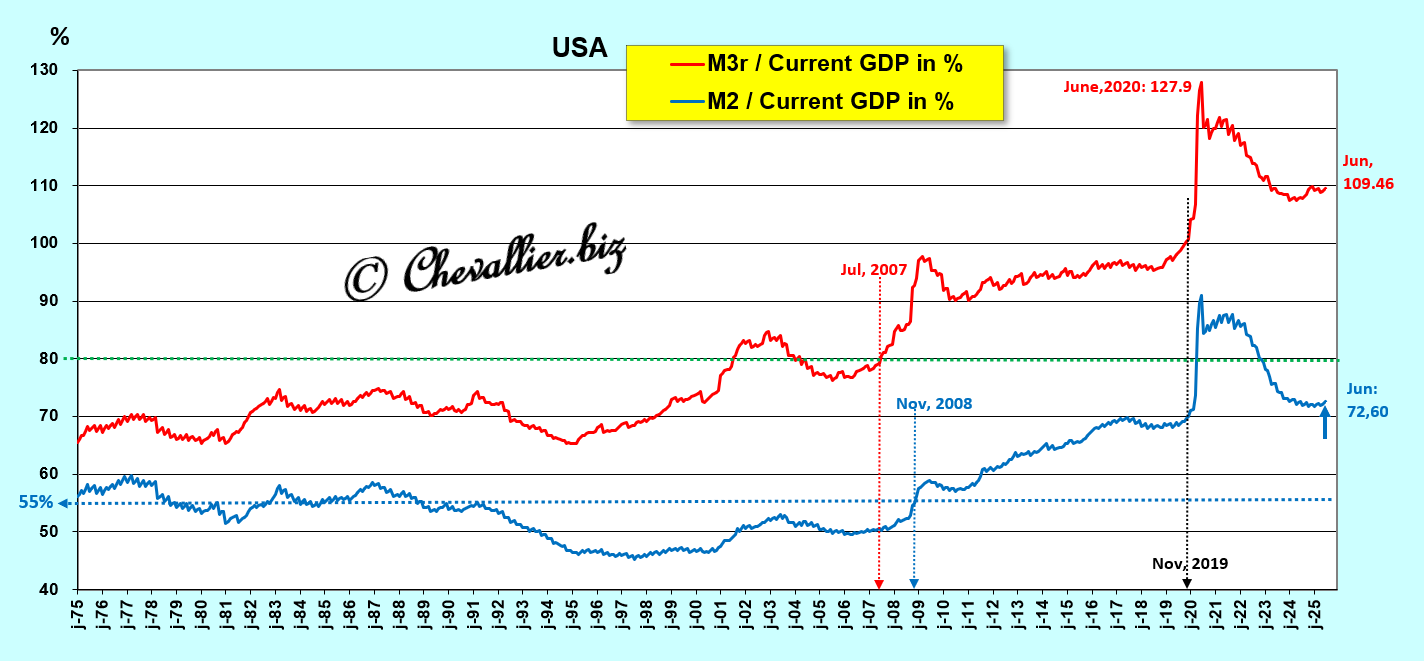
The explanation for the divergence in these ratios is simple: corporate cash holdings declined in the first quarter of 2025, whereas they had been expanding rapidly previously!
Document 5:
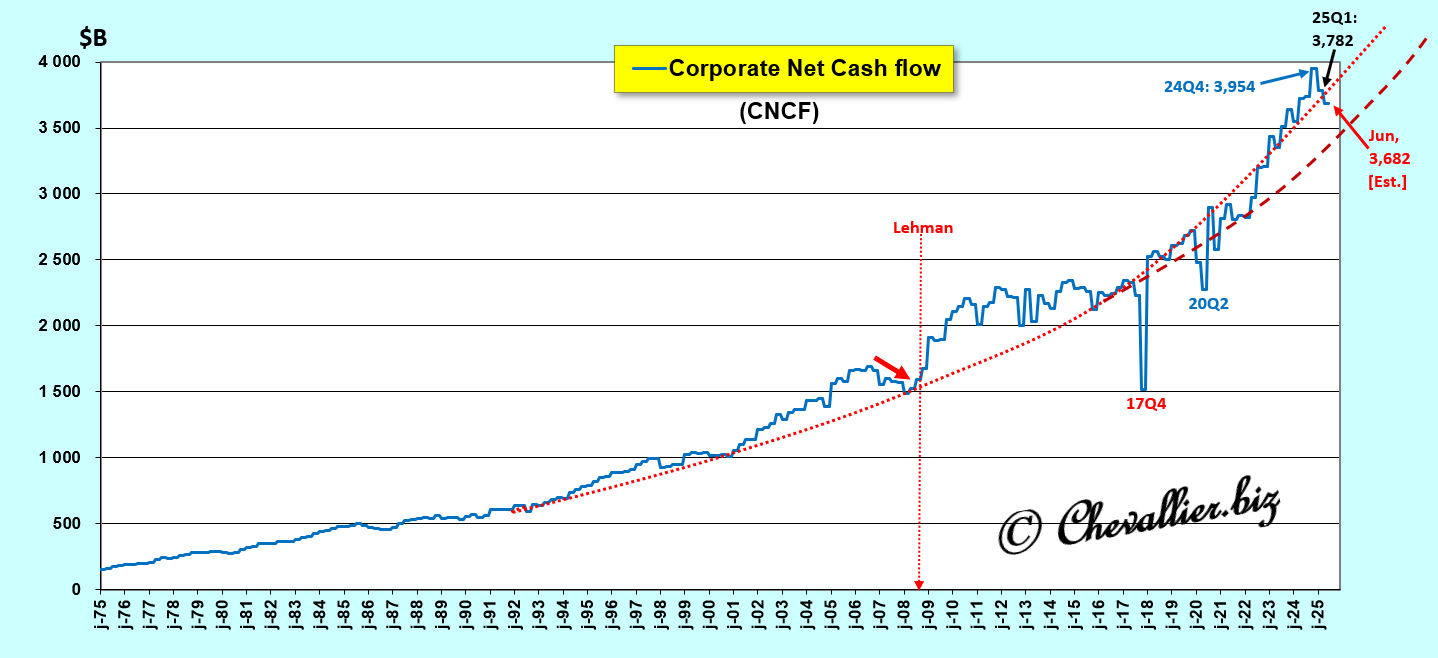
It is clear from this graph 5 that the increase in corporate cash holdings in the United States was abnormally high after 2020 (marked by the distribution of $6 trillion by the federal government without any quid pro quo in terms of jobs), which is also reflected in the irrational exuberance of the stock market valuations of a number of listed companies.
This is likely the first manifestation of the momentum crash that is brewing, exacerbated by Donald Trump’s tariffs.
It is surprising that no one has noted this $172 billion decline in corporate net cash flow (Corporate Net Cash Flow), figures published on June 26 by the BEA (U.S. Bureau of Economic Analysis).
As a reminder, the Great Recession of 2008 was also preceded by a decline in corporate cash flow, which is logical.
***
Below, we will only consider data from the M2 monetary aggregate, as it is the only data published on a monthly basis…
Obviously, the M2 monetary aggregate jumped in 2020, but after a slight decline, the all-time high of $21,750 billion reached in April 2022 has been exceeded since last April, peaking at the end of June at $22,020.8 billion, the latest figures published to date!
Document 6:
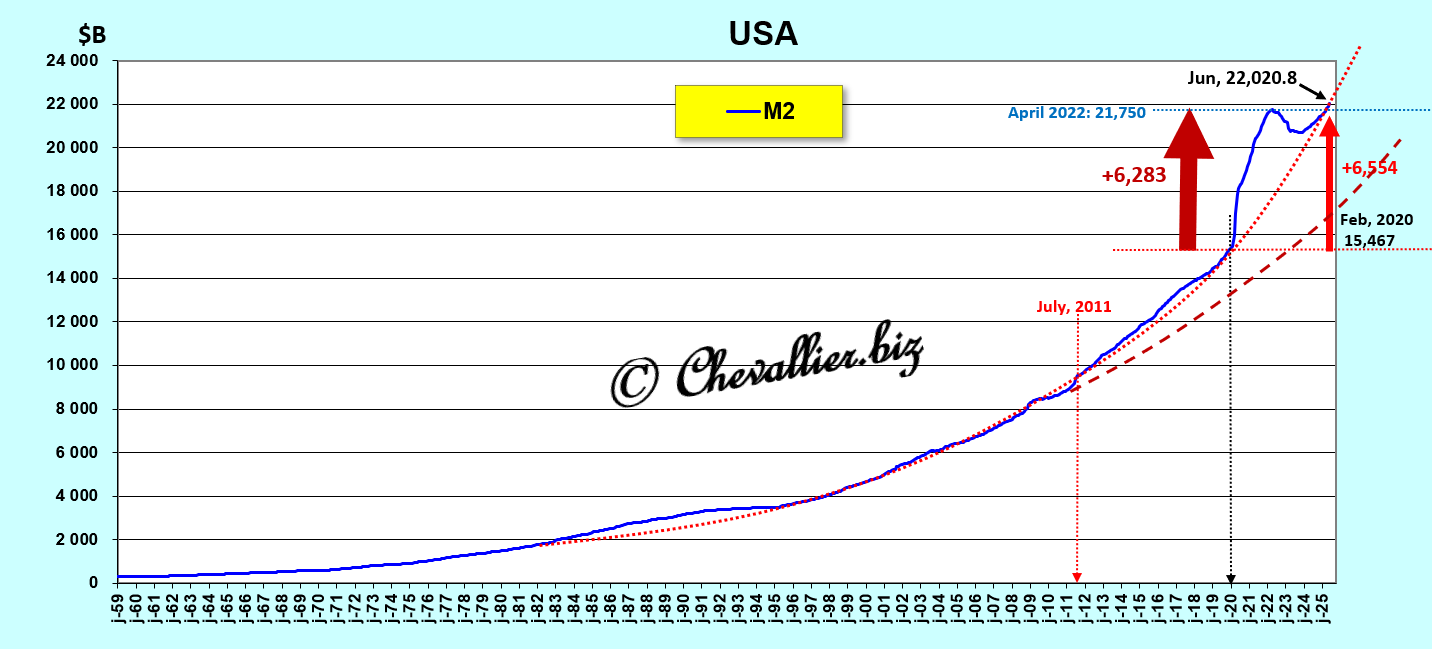
The dark red dotted line on Document 6 represents the trajectory that the M2/GDP ratio should have followed, respecting its 40% limit, which clearly shows the monetary hypertrophy emanating from this M2 aggregate.
A closer look at the evolution of the M2 aggregate since the beginning of 2019 shows that at the end of June, it broke its previous record high of $22,020.8 billion, which had already been exceeded at the end of April!
Document 7:
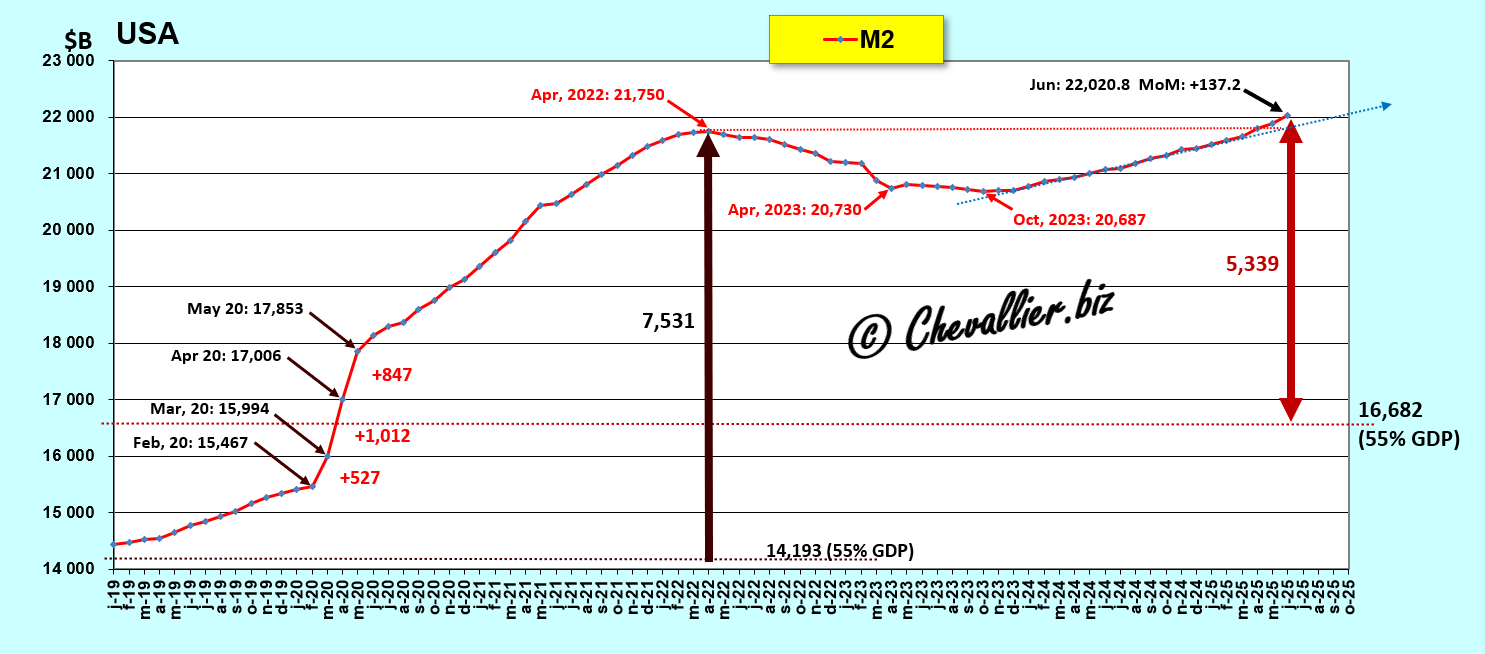
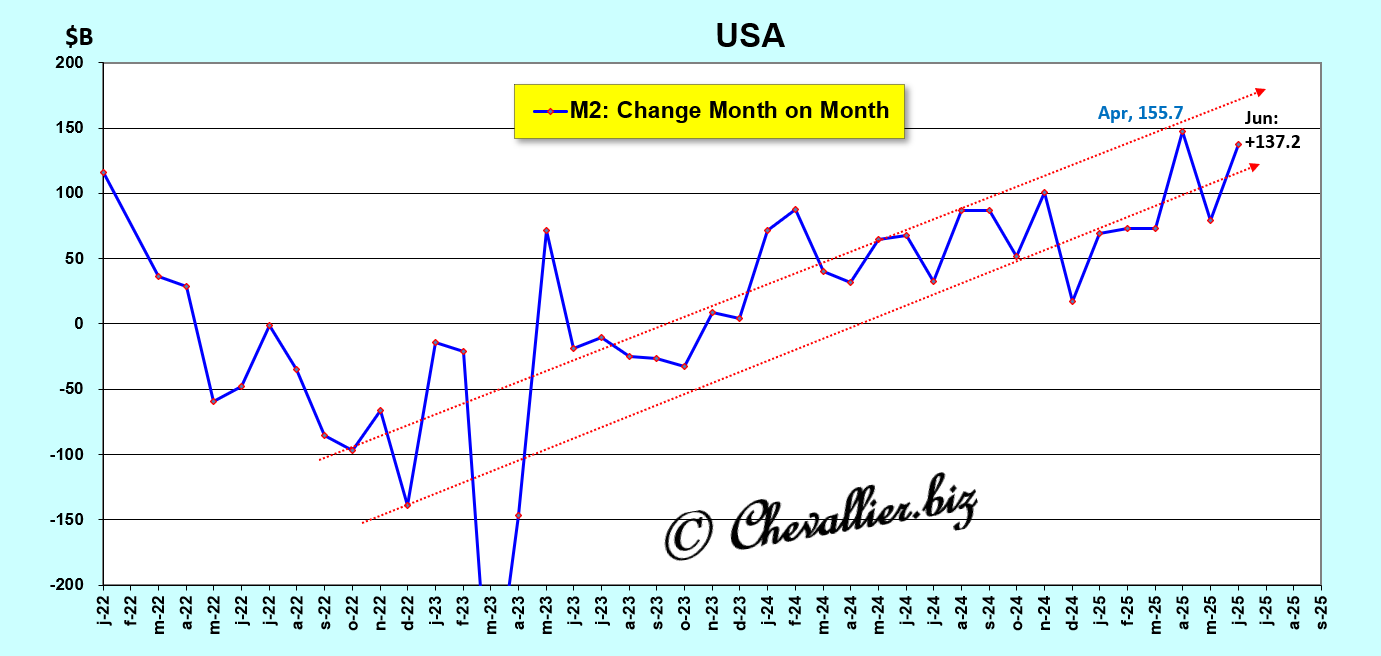
Month-on-month variations in the M2 monetary aggregate have increased since the early 2000s, with extraordinary upward and downward swings since 2020.
Document 8:
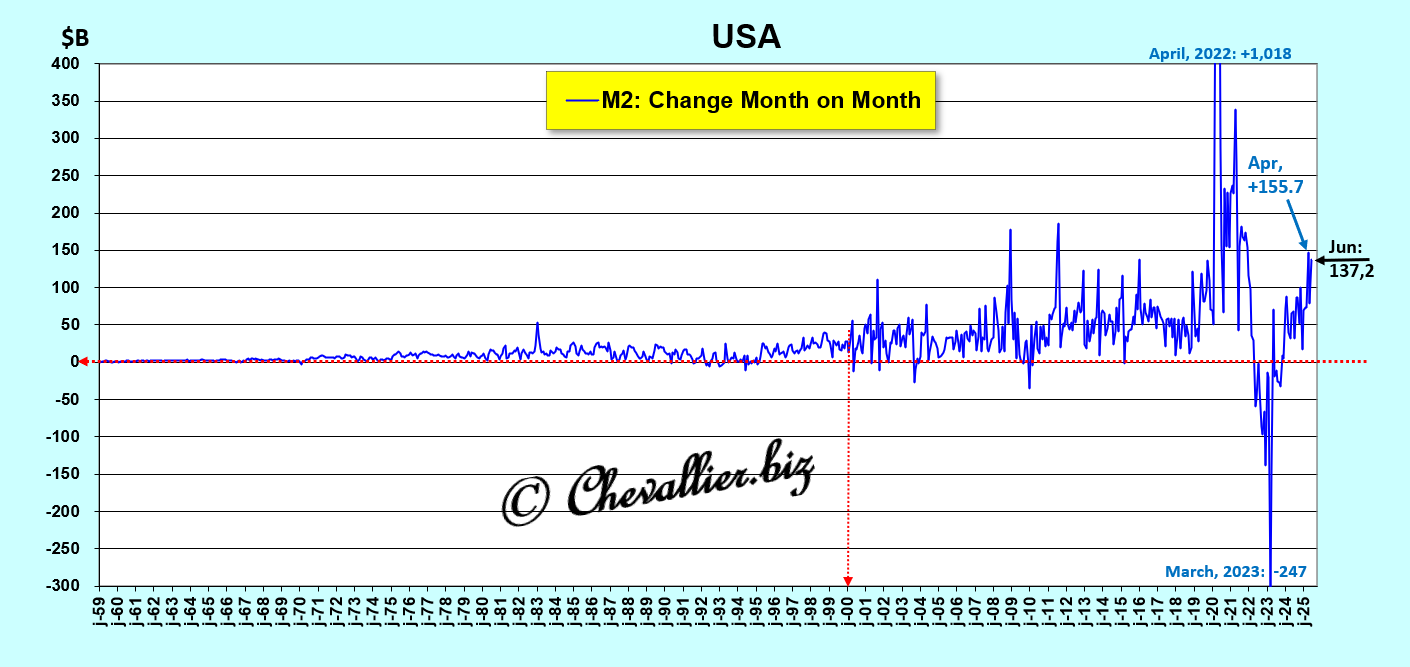
A closer look at the period from 2022 to the present shows that the M2 money supply is increasing month by month, with a clear upward trend, reaching $137.2 billion at the end of June (compared to the end of the previous month), according to the latest figures published to date.
Document 9:
The big problem now facing the US authorities is how to burst this huge monetary bubble!
According to statements by Jerome Powell and other former and current members of the FOMC, the measure that previously made it possible to burst such a developing monetary bubble was (relatively) simple: all they had to do was raise the Fed’s base rate to the point of creating an inverted yield curve, which inevitably led to a recession of varying severity but sufficient to restore the right ratios.
However, this solution no longer works because the monetary bubble is too big!
***
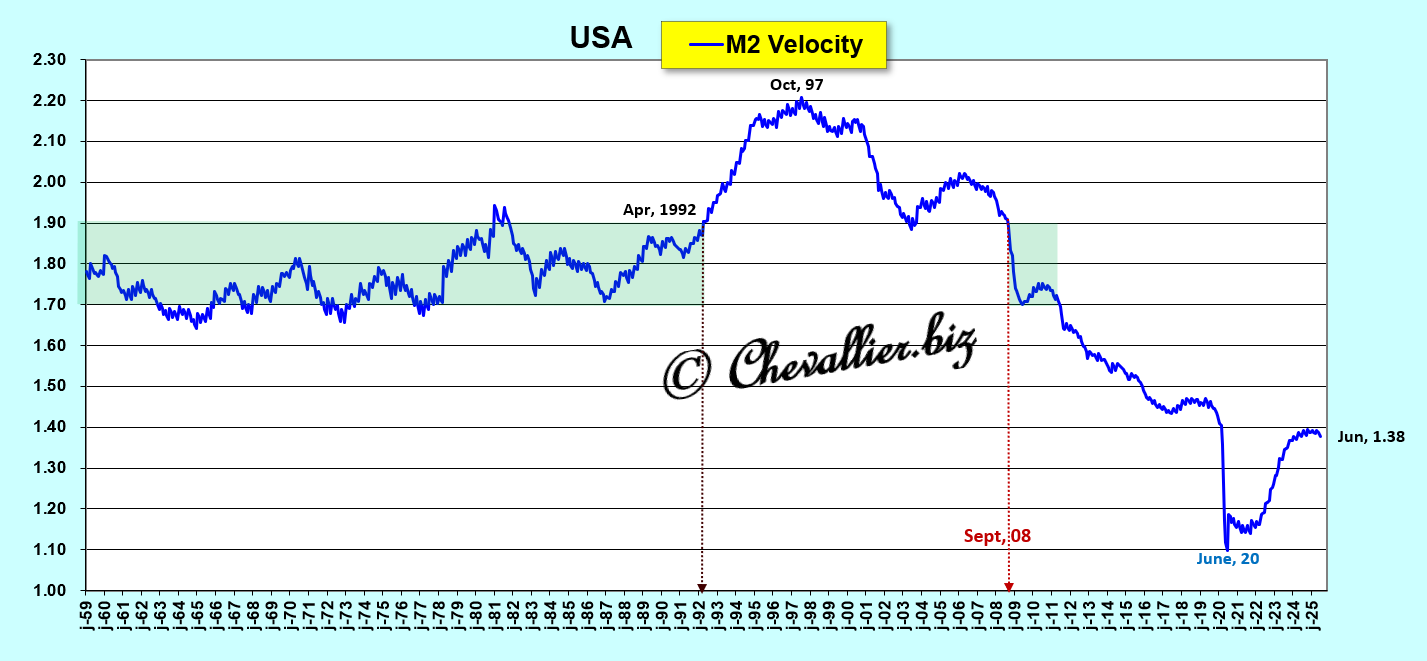
The velocity of money (velocity), measured using the M2 monetary aggregate, is the ratio of current annual GDP to this M2 monetary aggregate, i.e. the inverse of the ratio of M2 to GDP, see documents 1 and 2 above.
This concept is rarely used because it is difficult to understand. In fact, only the principle is relevant: the faster money circulates, the stronger the growth, and vice versa.
This velocity of money has been falling since a peak in 1997, plunging to a historic low in June 2020 because of those who created this coronavirus story!
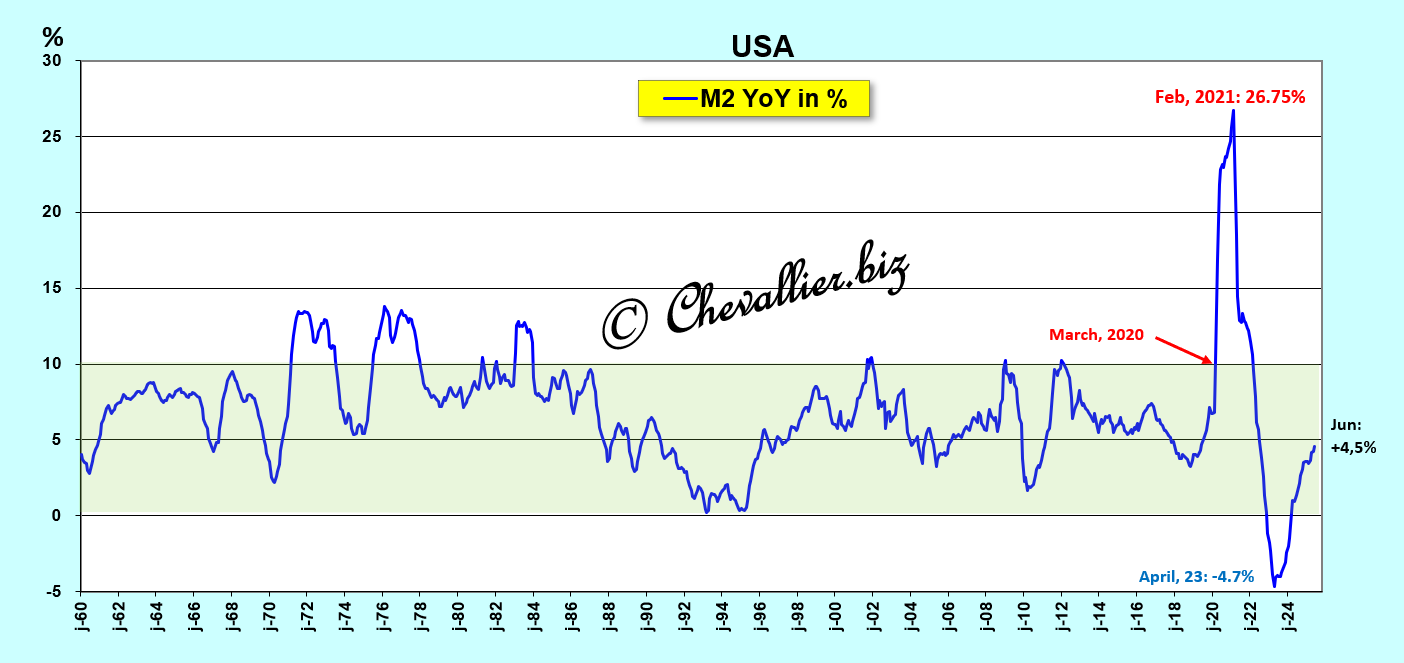
Document 10:
Given the hypertrophy of the money supply in 2020-2021, year-on-year variations in the M2 monetary aggregate are beginning to return to normal.
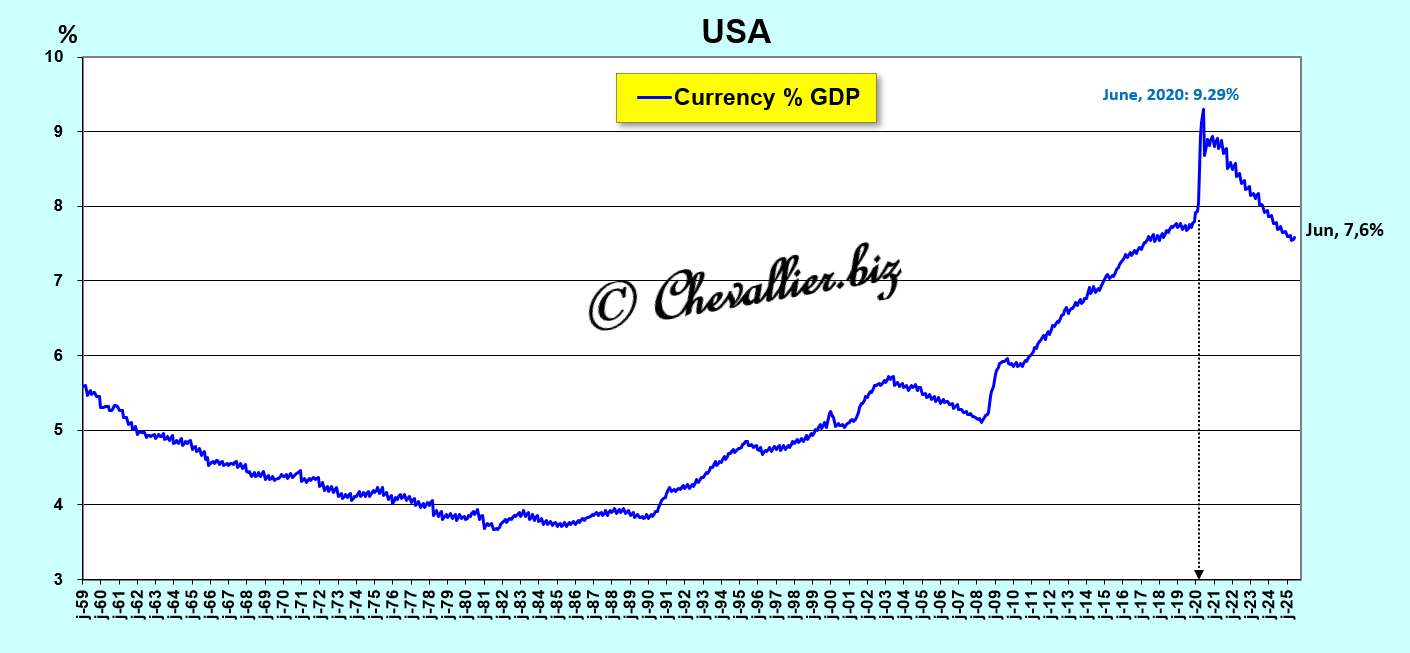
Document 11:
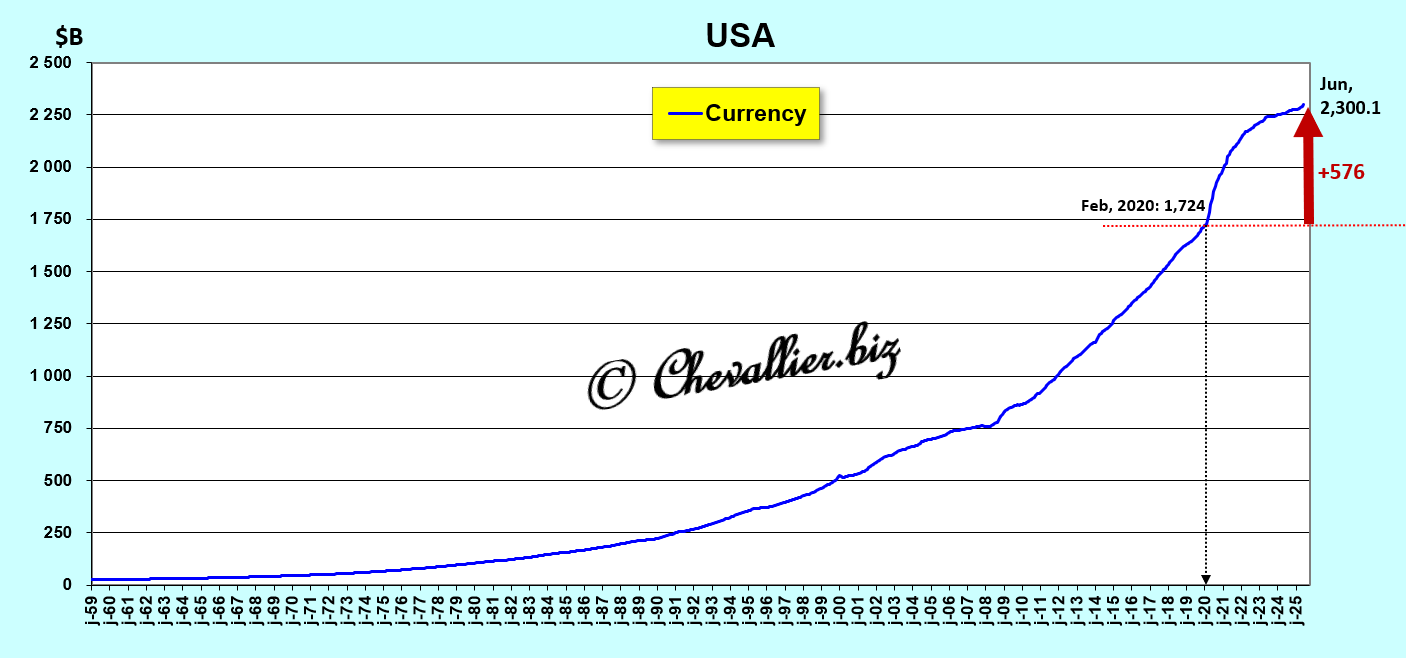
The increase in banknotes in circulation after 2020 is significant but not catastrophic.
In fact, the hypertrophy of the money supply does not stem from the untimely use of the famous money printing press, but from the distribution of more than $5 trillion with no real counterpart in the form of bank transfers paid to many Americans and some of their companies.
The share of these banknotes in circulation relative to GDP is marginal. It has returned to normal levels.
Document 12:
For information, here is the evolution of the total number of banknotes in circulation, most of which are actually outside the United States in hands that are not always very clean…
Document 13:
***
An excessive money supply in a nation has the major disadvantage of being lethal in the long run, as it always causes a major and lasting crisis, cf. among others, Germany between the two world wars and Pierre Jovanovic’s book (in French) on the subject: Hitler or the Revenge of the Money Press!
On the other hand, this same hypertrophy of the money supply has the advantage of providing banks with short-term liquidity that allows them to… avoid bankruptcy!
***
As a reminder, analyzing monetary aggregates is the best way to steer the evolution of a nation’s economy and therefore to understand the mechanisms that drive it.
Ben Bernanke ended the weekly publication of monetary aggregate figures and the M3 monetary aggregate when he took over as head of the Fed, and Jerome Powell changed the definition of the M1 monetary aggregate, publishing only monthly figures for M2, which remain the only reliable data on this subject.
Ben Bernanke and Jerome Powell have therefore done everything they could to mislead all monetarist analysts.
Their refusal to publish all the useful monetary aggregate figures on the grounds that they are not important means in reality that they are so important that they refuse to share them with the general public.
***
Ronald Reagan, who was in contact with Milton Friedman, had a good understanding of monetary policy and surrounded himself with competent advisors, the Reaganomics team, who were instrumental in the success of his economic policy, which brought about a lasting recovery in the US economy.
This is not the case with Donald Trump.
***
In the illustration, Ronald Reagan, then president with some of his… Reaganomics.
© Chevallier.biz