




The accelerated growth of the M2 monetary aggregate in recent months is contributing to an increase in the U.S.’s overall M3 money supply, which was already at an extraordinary level.
The hypertrophy of this U.S. money supply will logically and inevitably lead to a decline in real GDP in the near future.
As a reminder, for any nation, the amount of money in circulation must not exceed a certain limit relative to wealth creation—that is, GDP.
Sound money is the first pillar of Reaganomics, according to Arthur Laffer, and it is also an application of my law on free money supply…
***
The month-over-month increase in the U.S. M2 money supply has returned to a fluctuation range of $50 billion to $100 billion that began in February 2024 after rebounding sharply in May 2026, reaching a peak of 255.7 billion dollars following a rise of 123.8 billion dollars in April—that is… 379.5 billion over those two consecutive months!
Document 1:
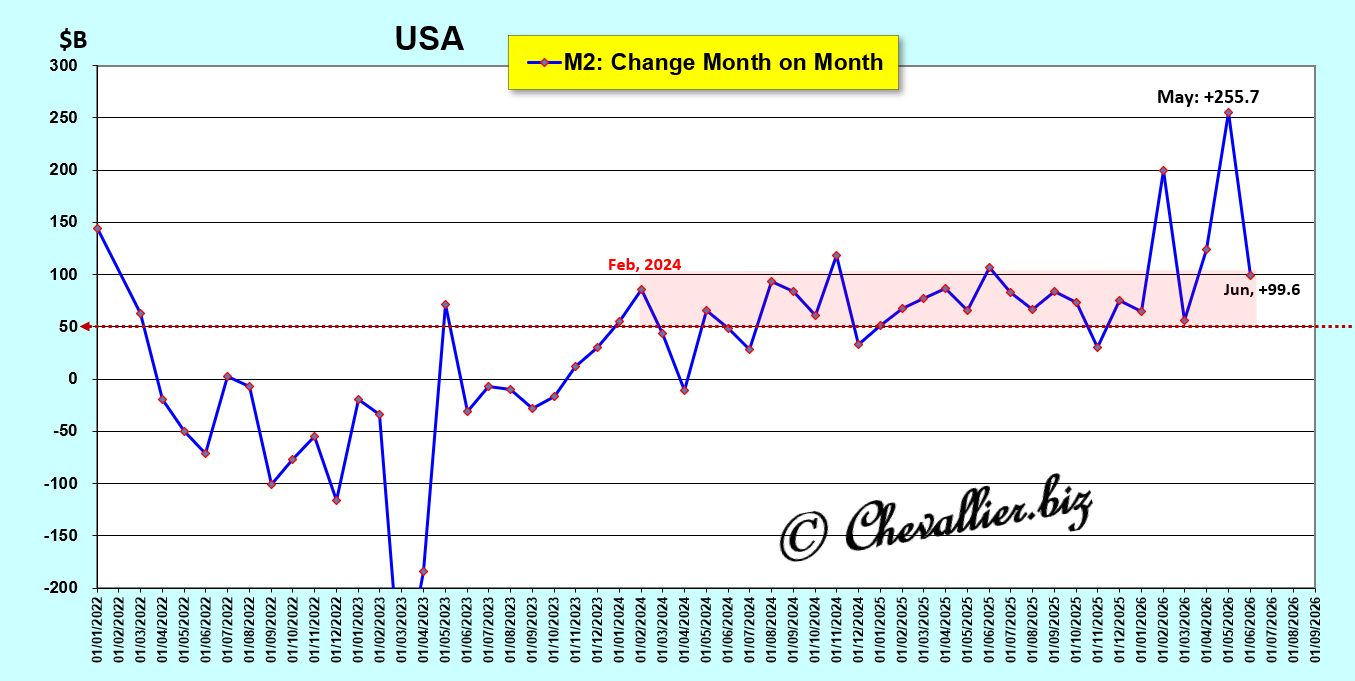
The $379.5 billion increase in the M2 money supply during the months of April and May 2026 alone corresponds to an increase in so-called precautionary savings on the part of Americans who feared that the war waged by the United States and Israel against Iran would create a situation that would be highly detrimental to them in the foreseeable future.
Month-over-month fluctuations in the M2 monetary aggregate were minor during the second half of the 20th century, but everything changed starting in the year 2000: these fluctuations became completely out of the ordinary, especially in 2020 (due to COVID) and more recently due to the war against Iran.
Document 2:
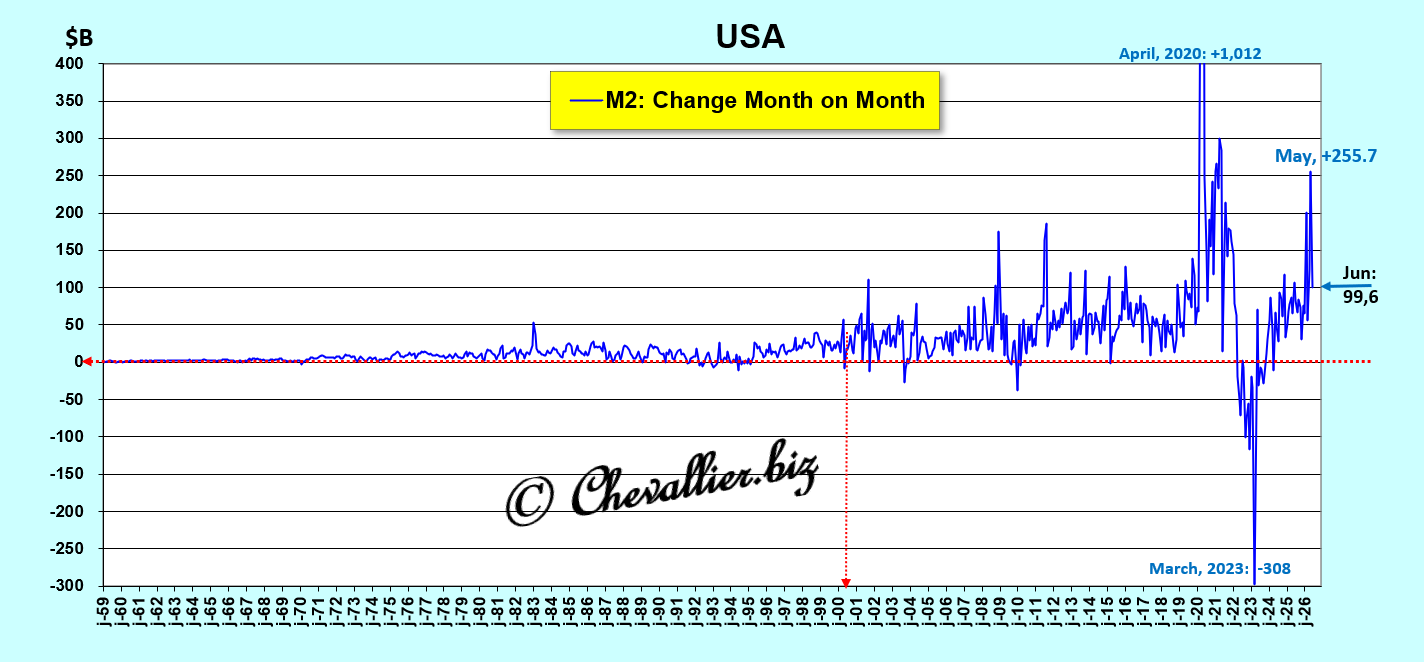
This is a normal reaction by Americans, who are thus setting money aside to cope with the deterioration of their standard of living in the near future.
As of the end of June 2026—the latest figures published to date—this M2 monetary aggregate reached a total of 23,155.2 billion dollars, of which…5,294 billion dollars are outside the norm,
Document 3:
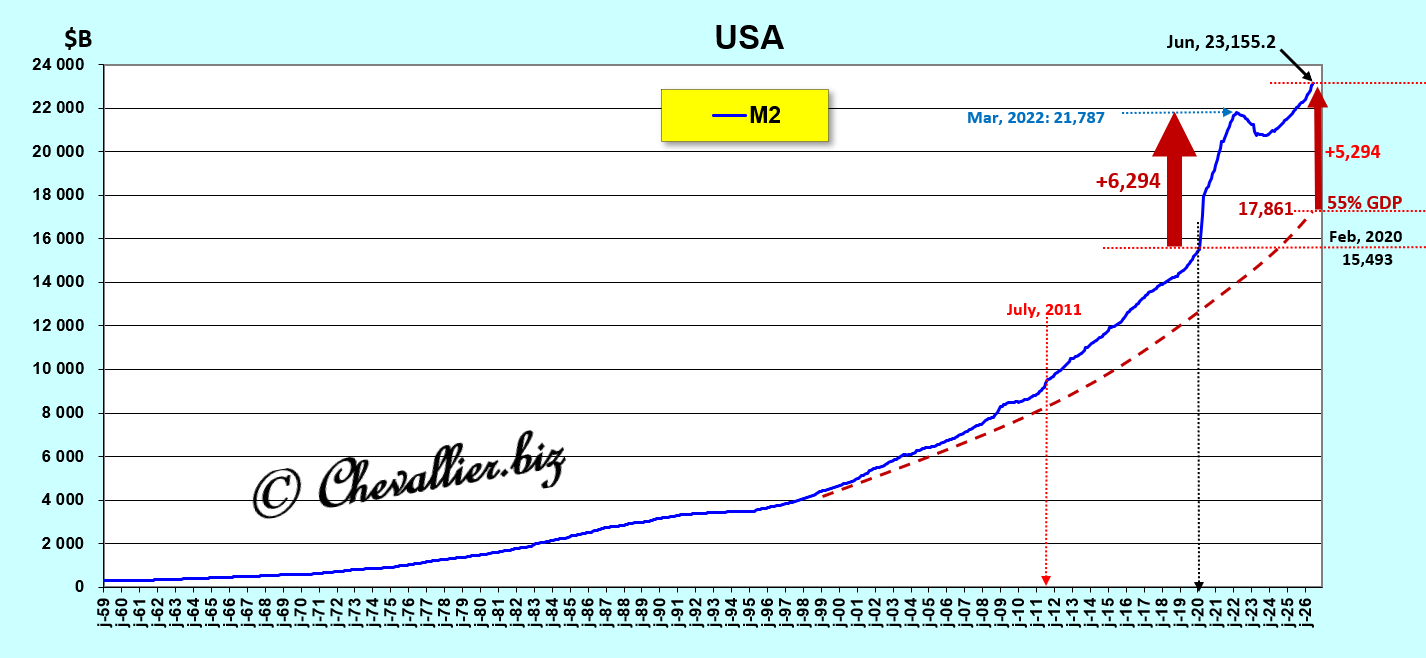
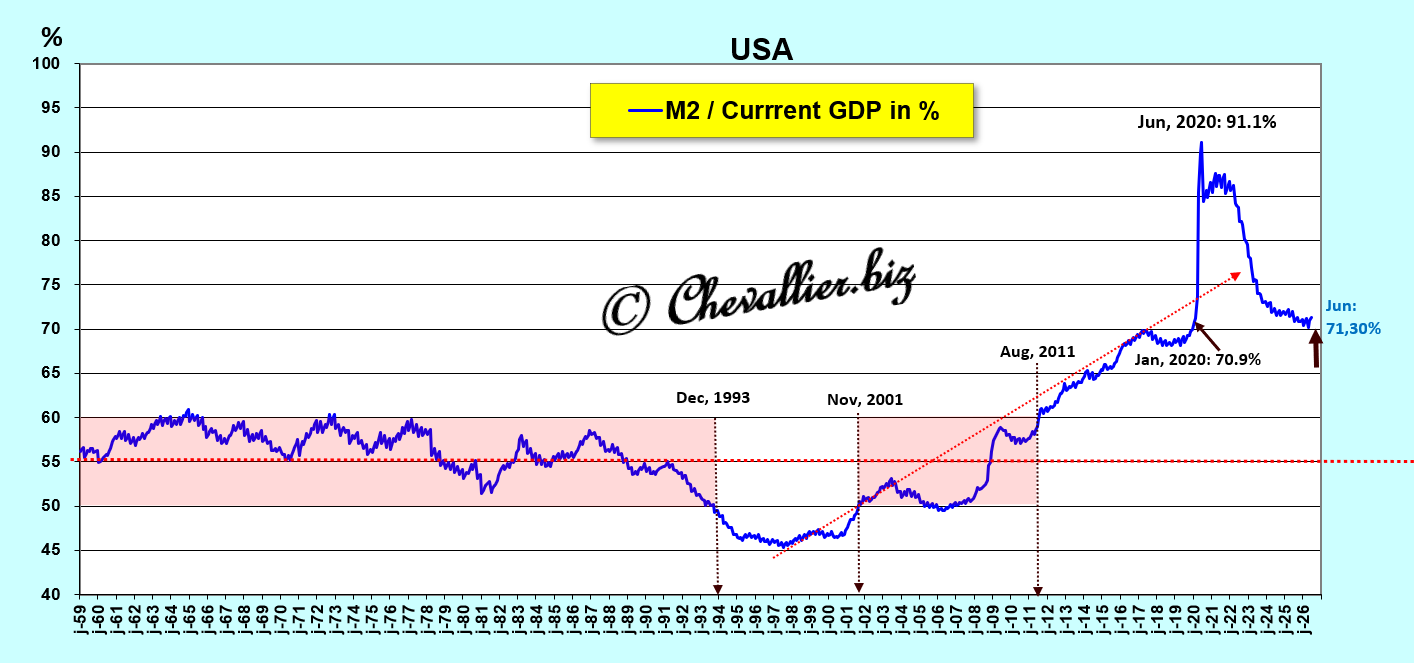
In absolute terms, the growth of this M2 monetary aggregate has once again far exceeded its normal long-term trend as it should have continued (dotted line).
A closer look at the recent period shows that the rise in this M2 monetary aggregate is diverging from its previous linear trend,
Document 4:
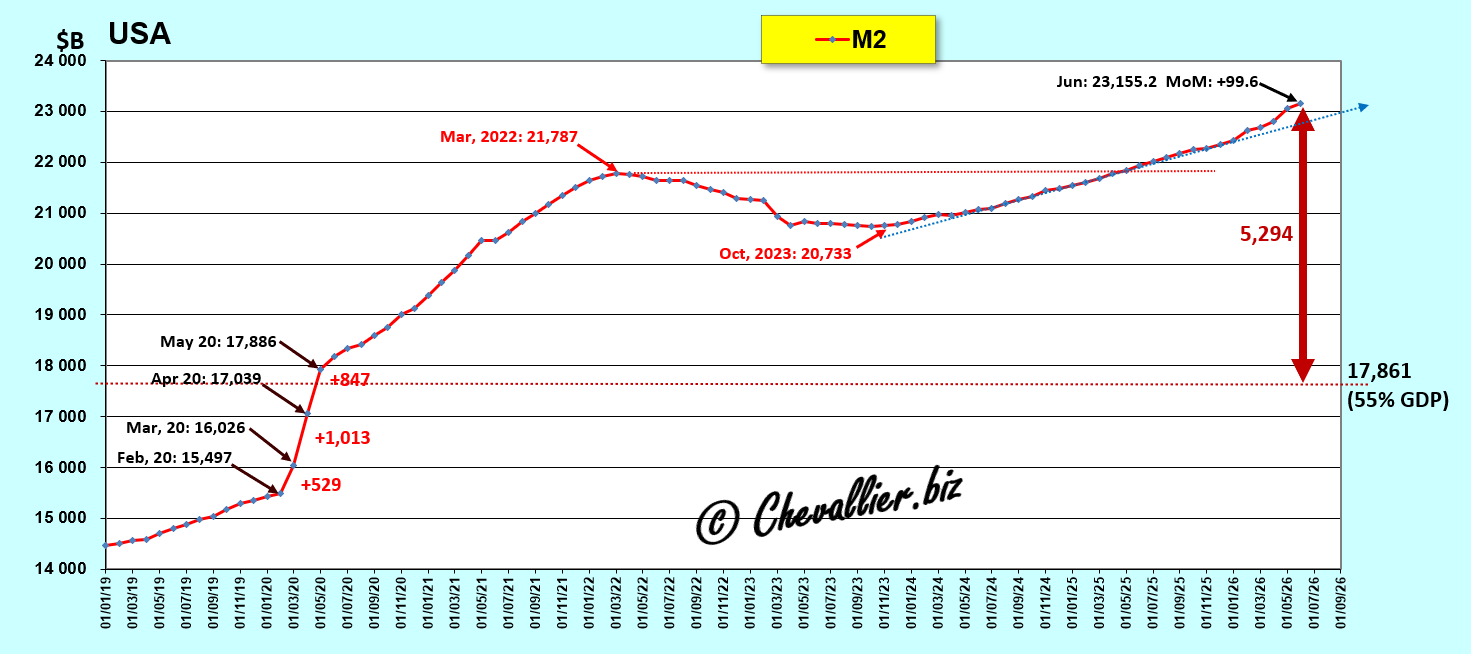
As a reminder, according to standards defined based on observations of changes in monetary aggregates since these data were first published (1959), the value of this M2 monetary aggregate should not exceed 55% of current annual GDP; see my articles on this subject—click here to access them.
These standards were more or less adhered to for 50 years but were exceeded following the Great Recession of 2008, skyrocketing in 2020 without returning to an acceptable range.
This M2/GDP ratio, expressed as a percentage, has clearly and dangerously begun to rise again during the month of June 2026, and this situation is expected to worsen further in the foreseeable future,
Document 5:
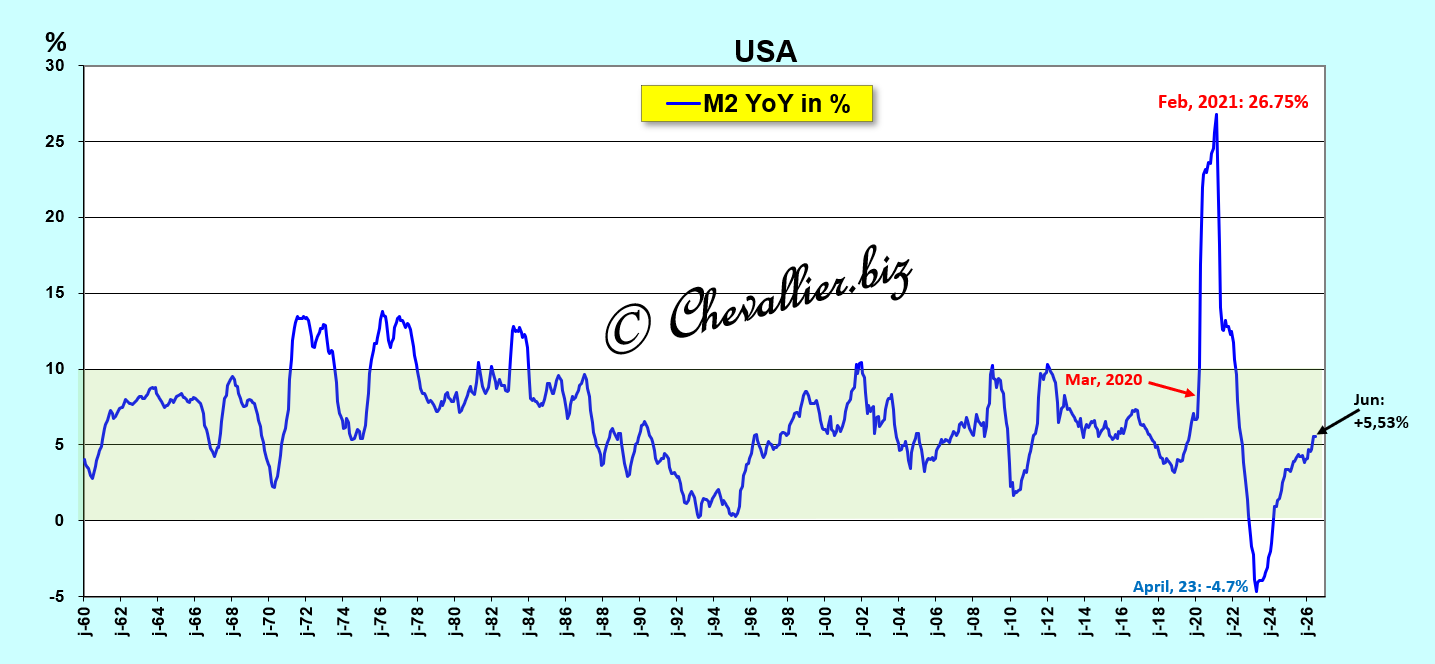
The year-over-year increase in the M2/GDP ratio (as a percentage) gives the impression that it is normal, but the money supply remains outside normal ranges because this ratio has been exceeded since 2011,
Document 6:
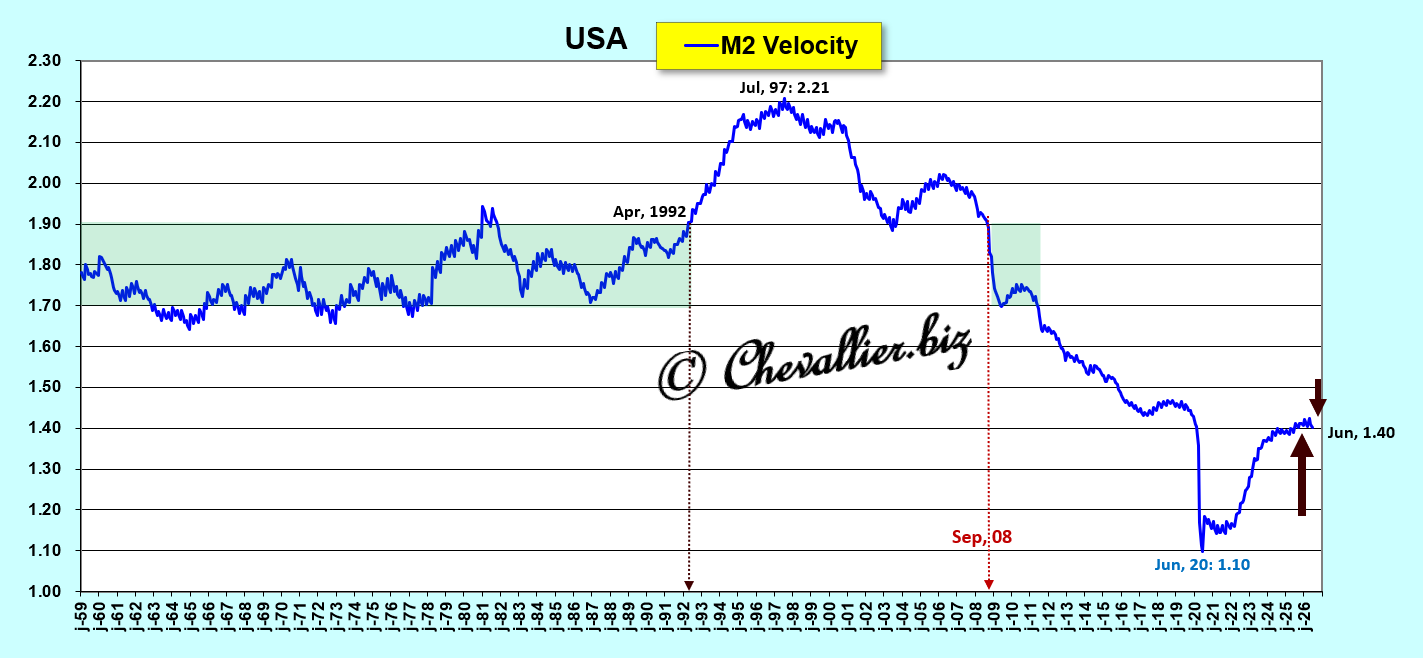
The velocity of money, which is the GDP/M2 ratio—that is, the inverse of the M2/GDP ratio (as a percentage)—calculated using the M2 monetary aggregate, had been fluctuating within a flat trend, but a trend reversal has occurred in recent months.
Document 7:
***
These data, once clarified and analyzed, help us understand the relationship between changes in a nation’s money supply and changes in its real GDP…
To put it simply, an increase in this M2 money supply held by Americans leads to a decline in real GDP, and vice versa, a pattern that holds true over the long term, ever since these data have been published by the Federal Reserve Bank of St. Louis’s FRED database.
More specifically, it is the change in what I call the free M2 money supply—which is the difference between, on the one hand, the change (year-over-year, in percentage terms) in the M2 monetary aggregate, and, on the other hand, (minus) the change in real GDP (year-over-year, in percentage terms)—that causes an inverse reaction in real GDP.
The $379.5 billion increase in the M2 monetary aggregate during April and May thus began to drive the free money supply up to 3.42%, but real GDP may not have declined due to extraordinary overinvestment in the artificial intelligence sector.
Document 8:
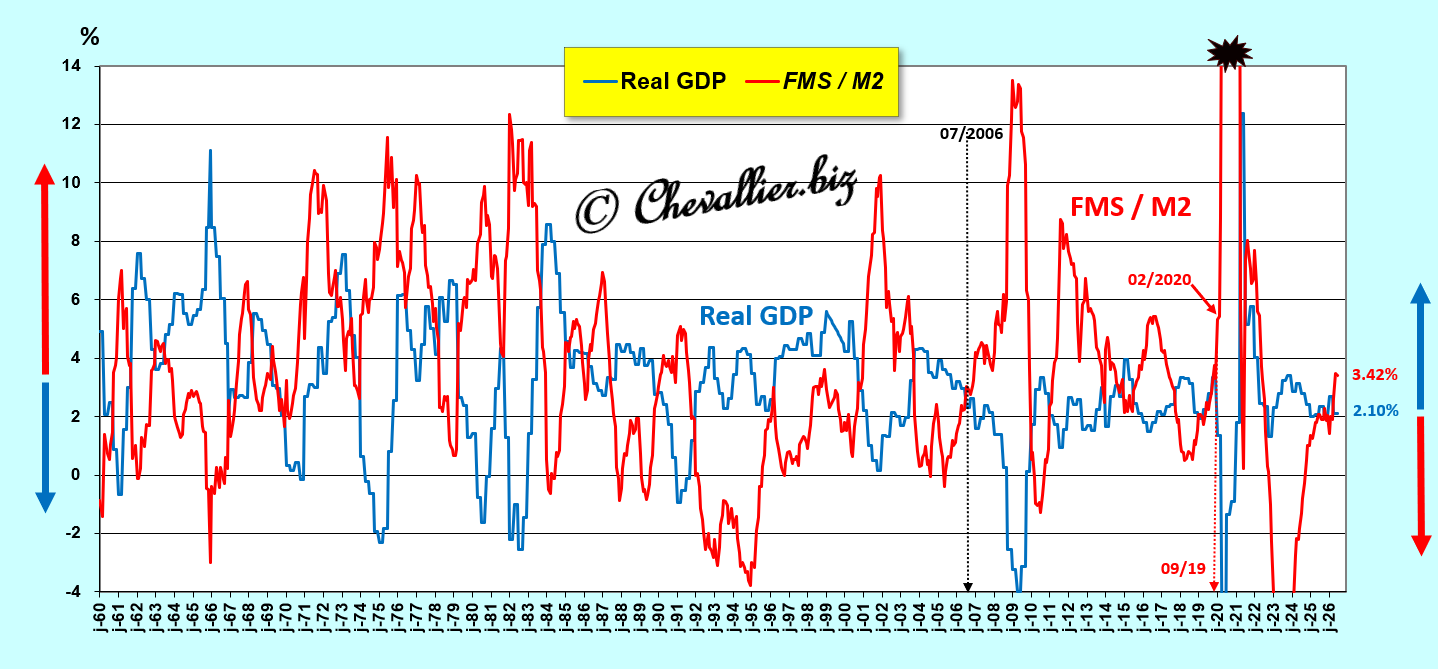
This law regarding the free money supply has been well verified, but primarily on the basis of the total money supply M3.
By considering only changes in the M2 monetary aggregate, the abnormal decline in real GDP over the long term can be explained by the increase in the M3-M2 monetary aggregate, which is clearly out of the ordinary.
As a result, the arithmetic trend lines for changes in the free money supply M2 and real GDP are not logically parallel, as the year-over-year increase in the free money supply M2 remains around 4.0%—a slight decline over the long term—while real GDP follows a distinctly downward trend from 4.0% to 2.0% due to the extraordinary expansion of the M3-M2 monetary aggregate.
Document 9:
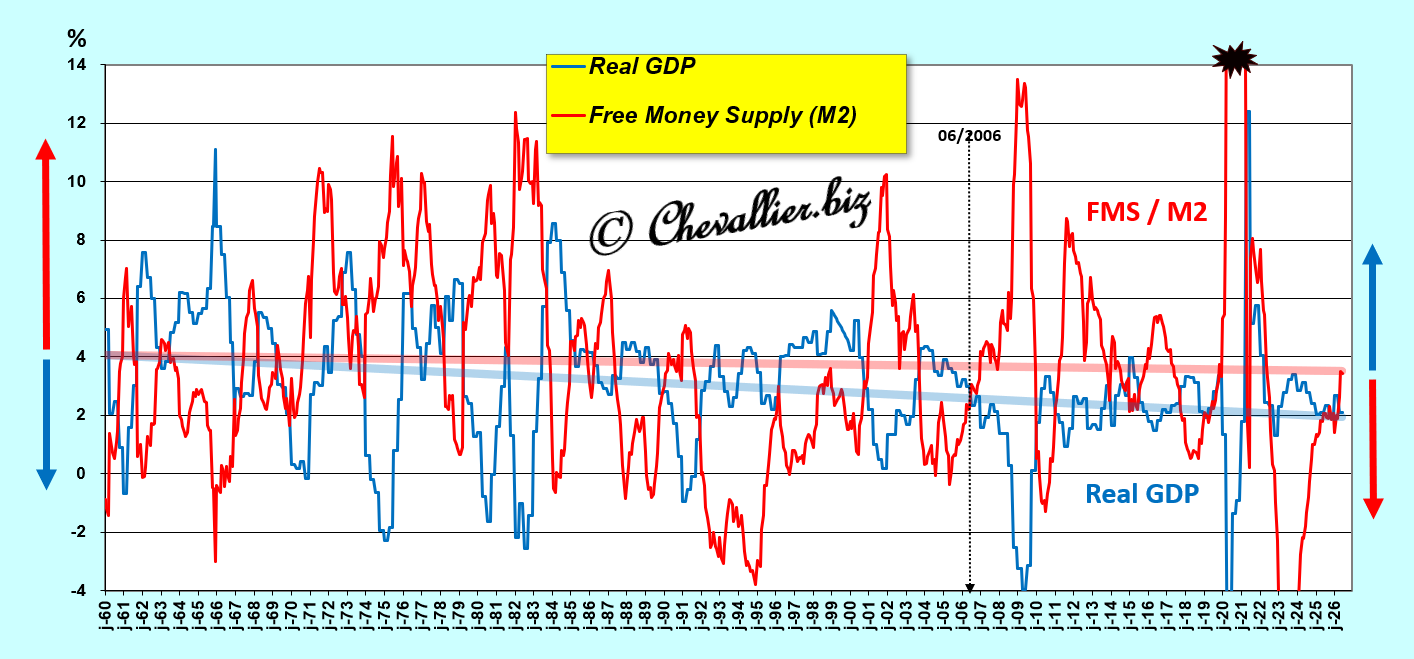
The 6th-order polynomial trend curves clearly highlight the alternating opposition in the variations of the data in these series over the long term, except for the recent period, which is anomalous.
Document 10:
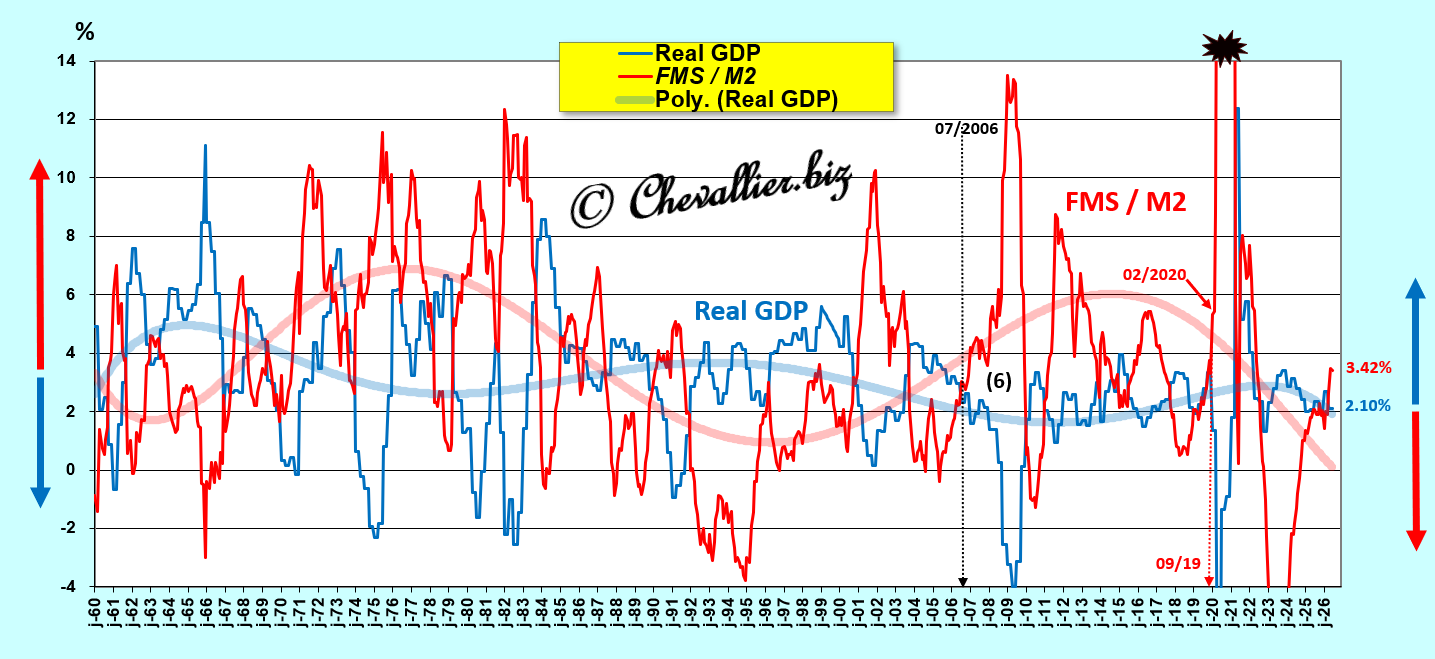
A closer look at the recent period since the early 2000s shows more precisely that the very significant increase in the M2 monetary aggregate over the past few months should have caused a decline in GDP, but this did not occur because GDP was boosted by extraordinary investments in artificial intelligence.
Document 11:
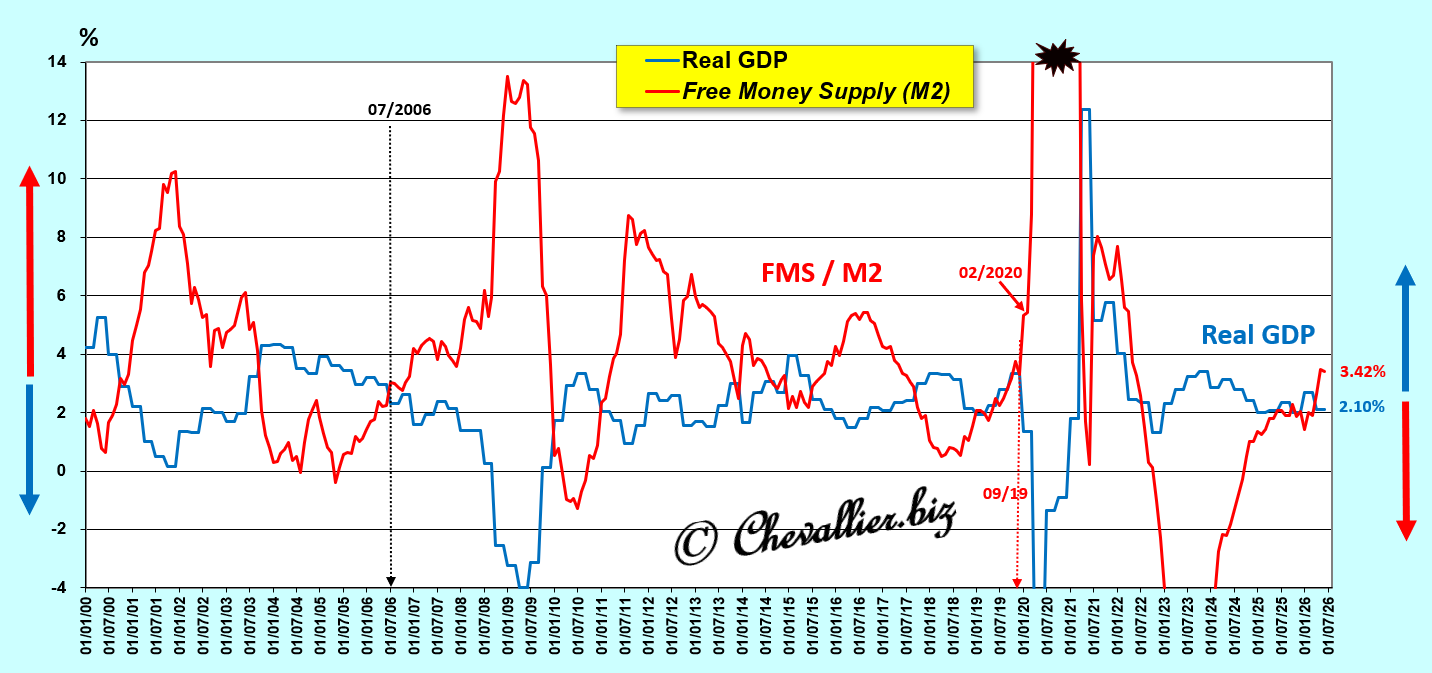
This law regarding the free money supply M2 holds up quite well for this period alone when considering the arithmetic trend lines of the changes in the free money supply M2 and real GDP, which are nearly parallel (but slightly converging and declining), falling from approximately 5.0% and 2.0% in 2000 to 3.5% and 2.0%, respectively, at the end of last June,
Document 12:
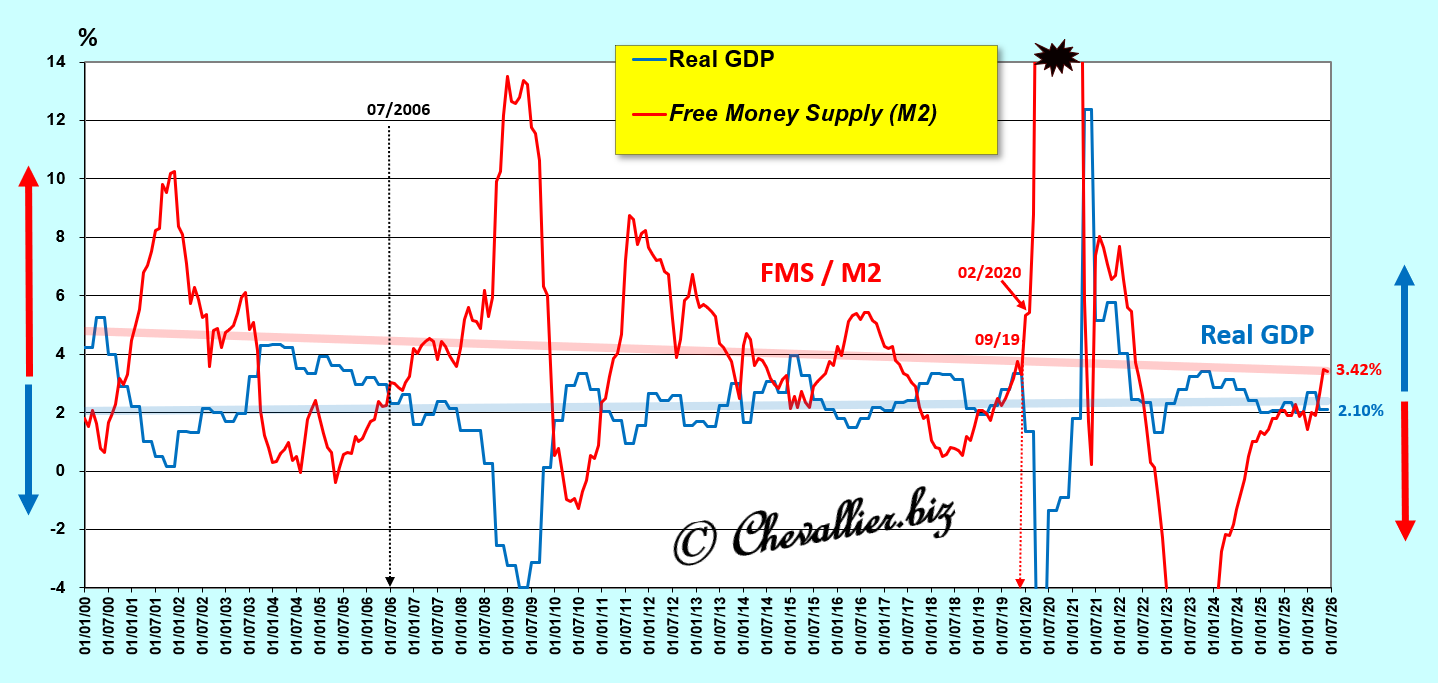
Logically, the line serving as the axis of symmetry between these curves remains virtually stable around 3.0% during this period—the first quarter of the 21st century—which confirms the relevance of this M2 money supply!
Document 13:
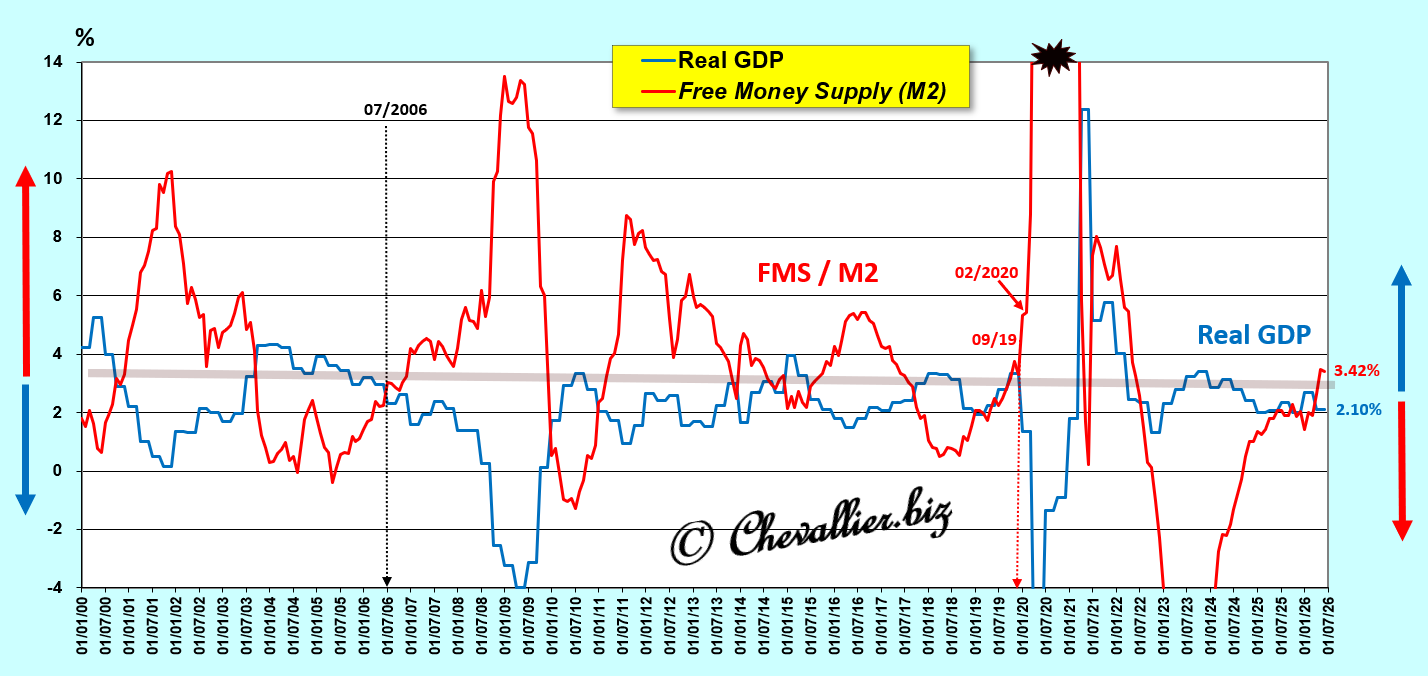
The increase in the M2 monetary aggregate should logically continue in the coming months, particularly due to the war against Iran, which will exacerbate the decline in GDP in the United States and elsewhere around the world due to shortages of certain hydrocarbon-related products and disruptions in supply chains.
***
As a reminder…
Analyses and conclusions regarding the impact of changes in monetary aggregates on real GDP have not been taken into account by financial market participants for the past twenty years or so, even though these issues and solutions form the foundation of any nation’s economic activity.
This is why Ben Bernanke took care to ensure that the Fed would no longer publish weekly figures for the M1, M2, and M3 monetary aggregates once he took office as chairman of the Fed in February 2006.
Subsequently, Jerome Powell added another layer of opacity by publishing only monthly data for the M2 monetary aggregate.
Thus, only those acting from within have access to this fundamental data, and they can manipulate financial reporting and the financial markets as they see fit!
This increase in the M2 monetary aggregate can be explained by the fact that Americans had already anticipated, as early as April, a possible further deterioration in their financial situation and thus generally increased their precautionary savings (M1-M2).
These Americans are the consumers and savers who form the foundation of economic activity, and they are also voters who can express their dissatisfaction in the upcoming midterm elections.
***
Click here to read my article explaining that the M2 money supply should not exceed 55% of GDP.
Click here to read my previous article on this topic.
Click here to read my article on my French-language website.
© Chevallier.biz