

The U.S. federal government’s actual net debt is neither extraordinary nor out of control. It is the subject of public opinion manipulation by certain entities. An in-depth look…
***
The U.S. government publishes the federal government’s gross debt daily, which as of May 14, 2026, stands at… $38,968 billion (circled in red)—a staggering figure that frightens everyone!
Document 1:
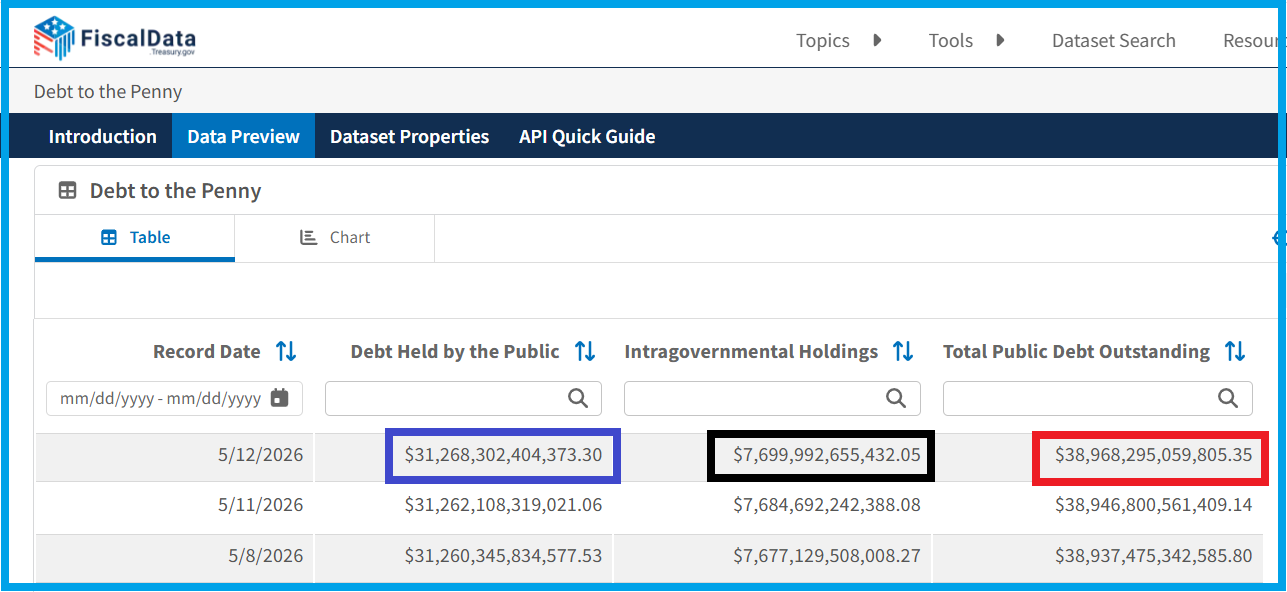
However, this document shows that government agencies hold $7.7 trillion of this federal debt (circled in black), which means that the federal government has both these debts and these claims on… itself!
To determine the actual amount of its net debt, one must subtract from the amount of its gross debt the amount of debt it holds on itself, that is, these 7.7 trillion dollars, which brings the actual net federal debt down to 31.268 trillion dollars (circled in blue).
[38,968 – 7,700 = 31,268]
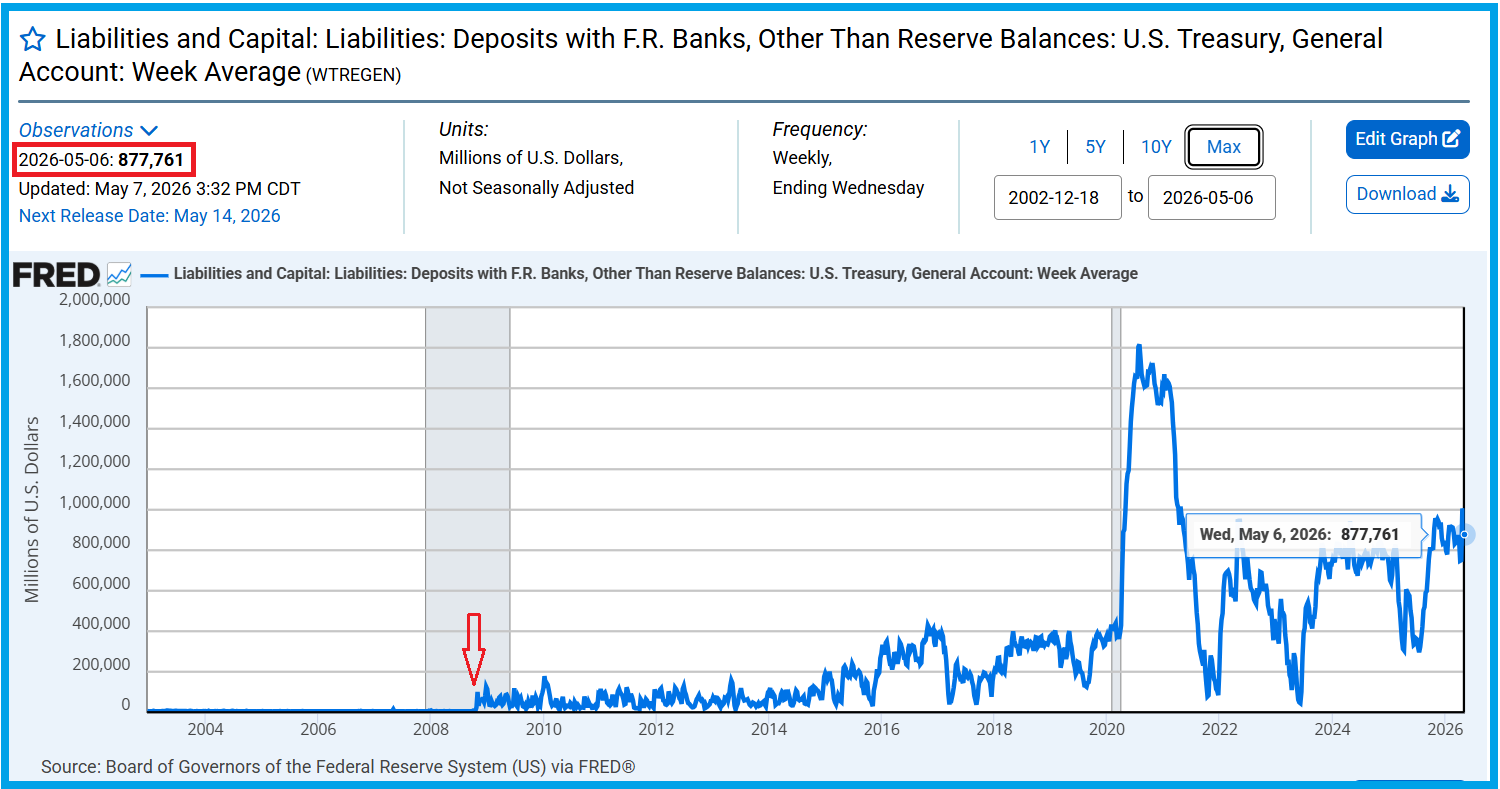
Furthermore, our friend Fred from St. Louis points out that the federal government’s cash balance is currently $878 billion, the latest figure published to date!
Document 2:
The U.S. government must pay federal government bills and repay maturing loans every day using resources provided by taxpayers—that is, their taxes.
However, until October 2008, the U.S. government carried out these operations with a cash balance of only about $5 to $10 billion.
However, everything changed starting in October 2008: the government’s cash reserves first surged to $100 billion and then fluctuated up to $400 billion.
Worse still, in 2020, the government’s cash reserves skyrocketed to… $1.817 trillion!
Why did the U.S. government seek to accumulate a cash balance that was—and still is—completely out of proportion to its spending needs?
No sensible answer has been provided by the Secretary of the Treasury—all the more so because… no sensible questions have been asked of her on the matter!
The federal government’s cash reserves therefore currently stand at $878 billion as of May 7, the latest figure published to date.
To determine the amount of the actual net federal debt, one must therefore subtract the astronomical amount of the federal government’s cash reserves (i.e., 878 billion dollars) from the previously determined debt amount, which is 30,391 billion dollars.
[31,268 – 878 = 30,391]
Furthermore, the U.S. government publishes the Fed’s balance sheet weekly, which shows… $4,434 billion in government securities consisting of Treasury bills.
Document 3:
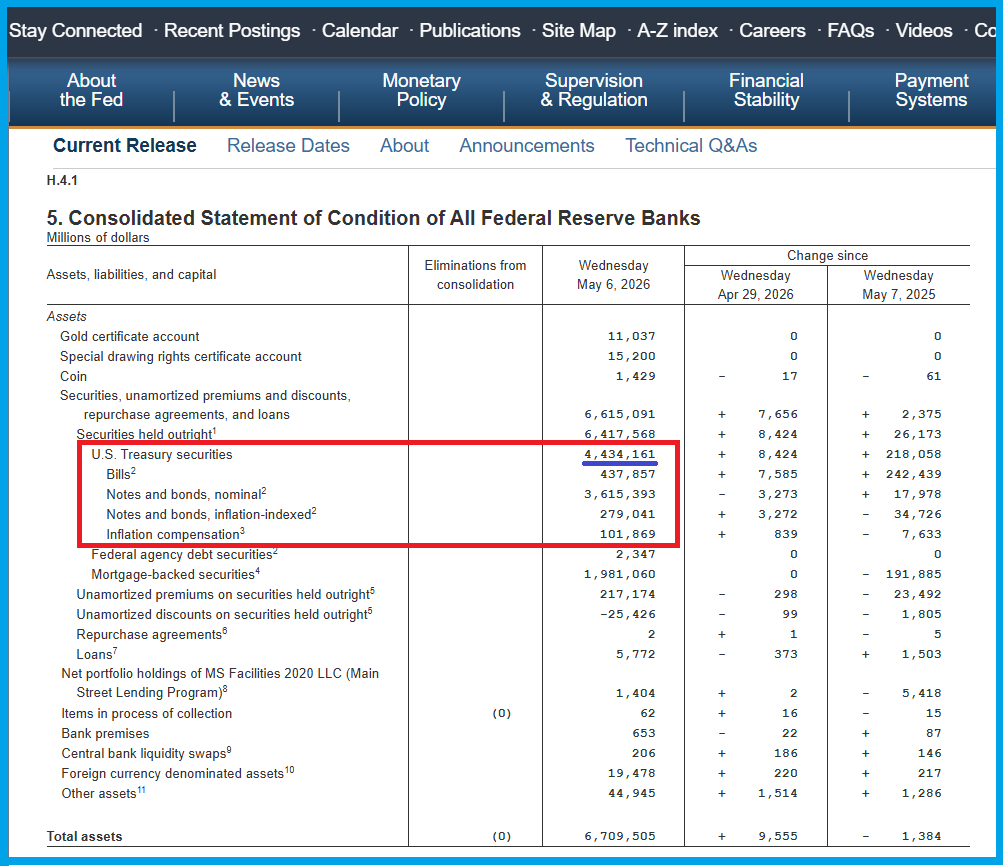
However, these $4,434 billion are intended to be repaid by the federal government itself, and the Fed is supposed to return these funds to the federal government at the end of the fiscal year.
For the same reasons as before, we must therefore subtract these $4,434 billion from the federal government’s debt amount determined earlier ($30,391 billion) to obtain the actual amount of the federal government’s net debt, which is $25,956 billion.
[30,391 – 4,434 = 25,956]
The federal government’s actual net debt is therefore ultimately $25,956.380 billion, which must be compared to the current annual GDP of $31,856.257 billion (as of March 31, 2026) according to the latest published figures,
Document 4:
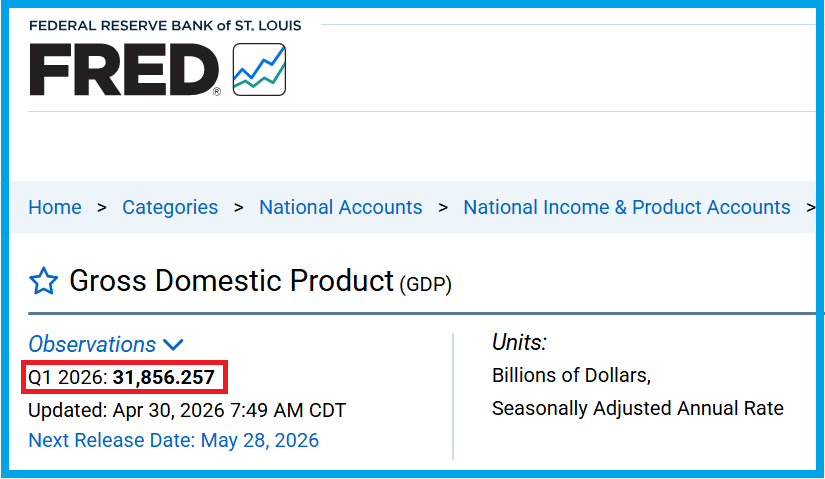
The federal government’s actual net debt therefore represents only… 81.48% of the U.S. annual GDP, which is considered normal, and not 120% as erroneously stated by everyone—and even by U.S. authorities!
[25,956 / 31,856 * 100 = 81.48%]
The first question that arises is this: why does everyone repeat the data published by U.S. authorities without even the most basic analysis?
The second question that arose in early 2025 was this: will the new Secretary of the Treasury Scott Bessent restore some order to the management of the federal government’s finances?
To date, the answer is clear: Scott Bessent has done nothing positive. He has only worsened the situation in America because, when he took office as Treasury Secretary, that debt-to-GDP ratio was only 80.1%!
***
America’sbiggest problemis not its debt, but its excessive money supply, which far exceeds normal levels—see my articles on this subject!
Indeed, according to standards defined based on observations of changes in monetary aggregates since these data have been published (1959), the amount of this M3 money supply should not exceed 80% of current annual GDP.
These standards were more or less adhered to for 50 years but were exceeded after the Great Recession of 2008, skyrocketing in 2020 without returning to an acceptable range, continuing to fluctuate around 110% of current GDP,
Document 5:
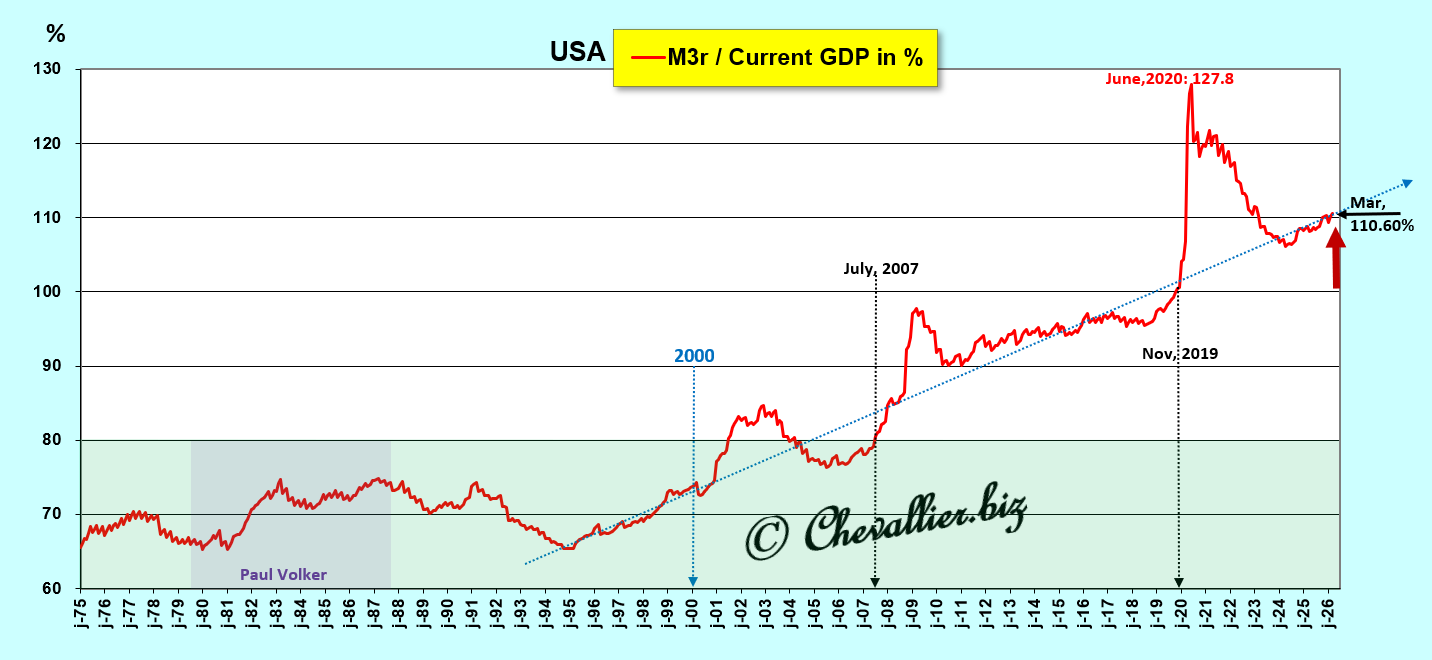
It is this excessive growth of the M3 money supply that has, since 2007, created these fundamental economic imbalances, which have had and will continue to have lethal consequences in the long term in the United States and elsewhere in the world.
During the second half of the 20th century, FOMC members consistently succeeded in keeping M3 within an optimal fluctuation band (below 80% of GDP) by raising the Fed’s base rate whenever there was a risk of exceeding the limits. Such measures have failed to produce the expected positive effects since 2008, precisely because of this monetary bloat.
Those who manipulate financial markets and public opinion lead the ignorant and unresponsive “common people” to believe (through highly effective propaganda, since “everyone” believes it) that U.S. public debt is a major and serious problem—which is not the case—while obscuring the existence of this monetary bubble; and it is this bubble that poses the biggest problem and is always lethal in the long run!
As a reminder, sound money is the first pillar of Reaganomics, and of monetarism, according to Arthur Laffer.
***
Click here to access the U.S. government website page publishing the federal government’s debt figure on a day-to-day basis.
Click here to access the Fed’s website page publishing its latest balance sheet.
Click here to access the website page of our friend Fred from St. Louis publishing U.S. Treasury cash flow figures.
Click here to access the website page of our friend Fred from St. Louis publishing GDP figures.
Click here to read my previous article on this subject.
Click here to read this article on my website in French.
©Chevallier.biz