

The excessive growth of the U.S. M3 money supply continues to rise: there is an excess of more than $10 trillion compared to normal levels, which is ultimately fatal.
***
Since the post-war period, the Fed had routinely published figures on the M3 money supply in circulation in the United States, just as central banks in all properly constituted countries have done for decades; however, Ben Bernanke decided to stop publishing them upon taking office as Fed Chair in February 2006.
However, I have managed to reconstruct the amount of the U.S. M3 money supply, denoted M3r with an r for revised, based on the components that make up the M3-M2 monetary aggregate, which are still published by U.S. authorities.
Indeed, this data is essential for any monetary analysis aimed at understanding and anticipating fluctuations in a nation’s economic and financial activity…
***
The M3r money supply continues to rise.
It reached $35,397 billion at the end of last February—the latest figures published to date—which corresponds to an expansion of more than… $10,000 billion compared to the standard of 80% of current GDP that should not be exceeded (see the explanations below after Document 5)!
Document 1:
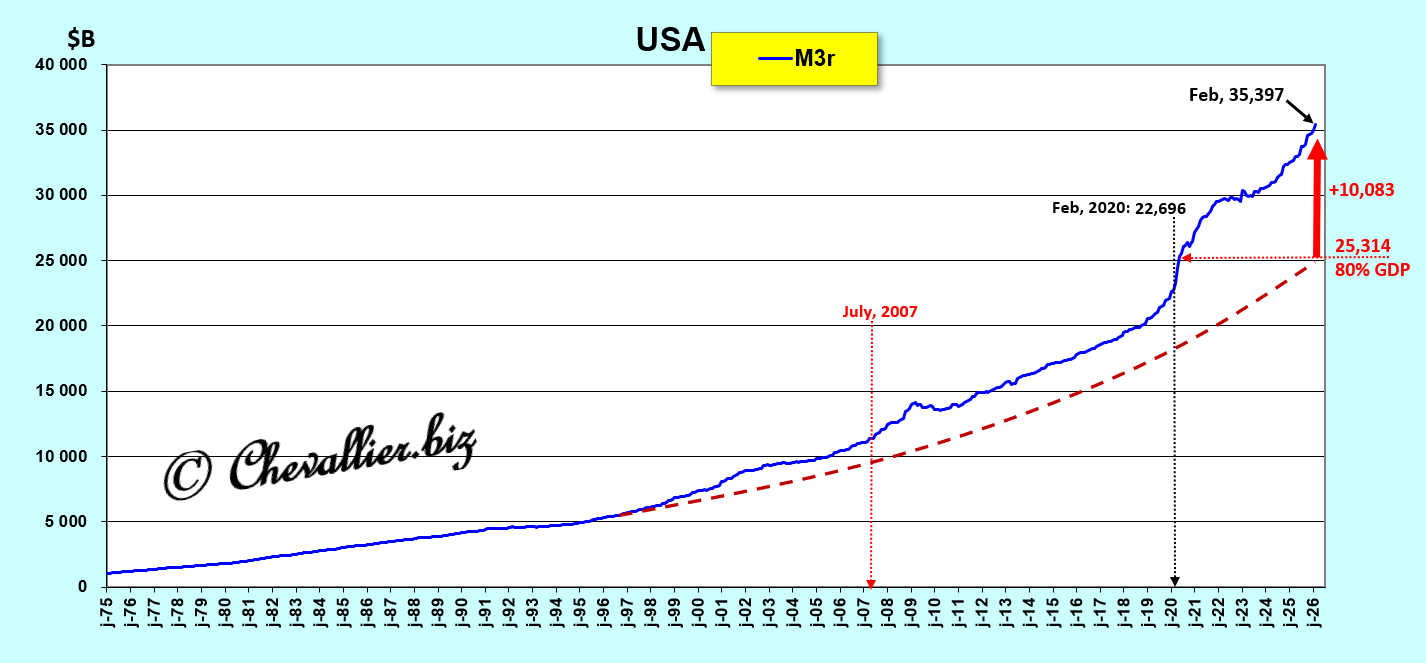
The long-term trend of this M3r/GDP (as a percentage) since these data have been published by our friend Fred of St. Louis, highlights that money remained sound in the United States during the second half of the 20th century, but that a monetary expansion ultimately fatal to the economy developed there, particularly starting in July 2007, exploding in 2020 with this coronavirus crisis, with the situation deteriorating further recently…
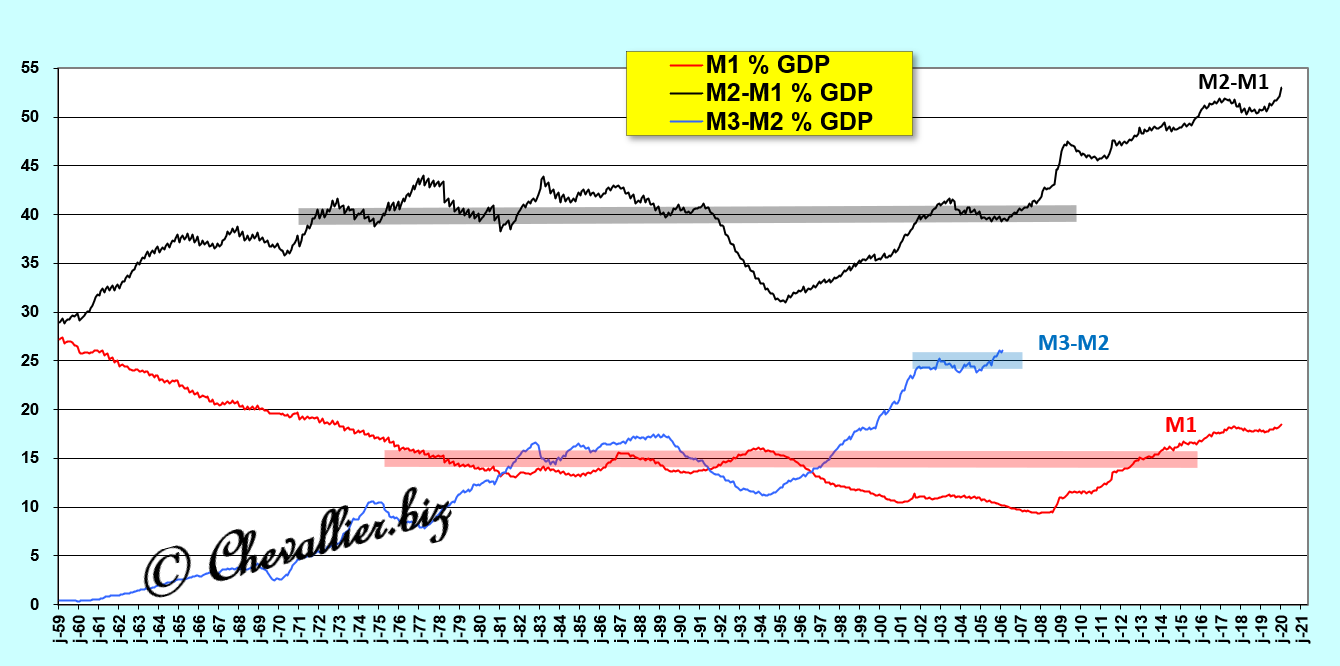
Document 2:
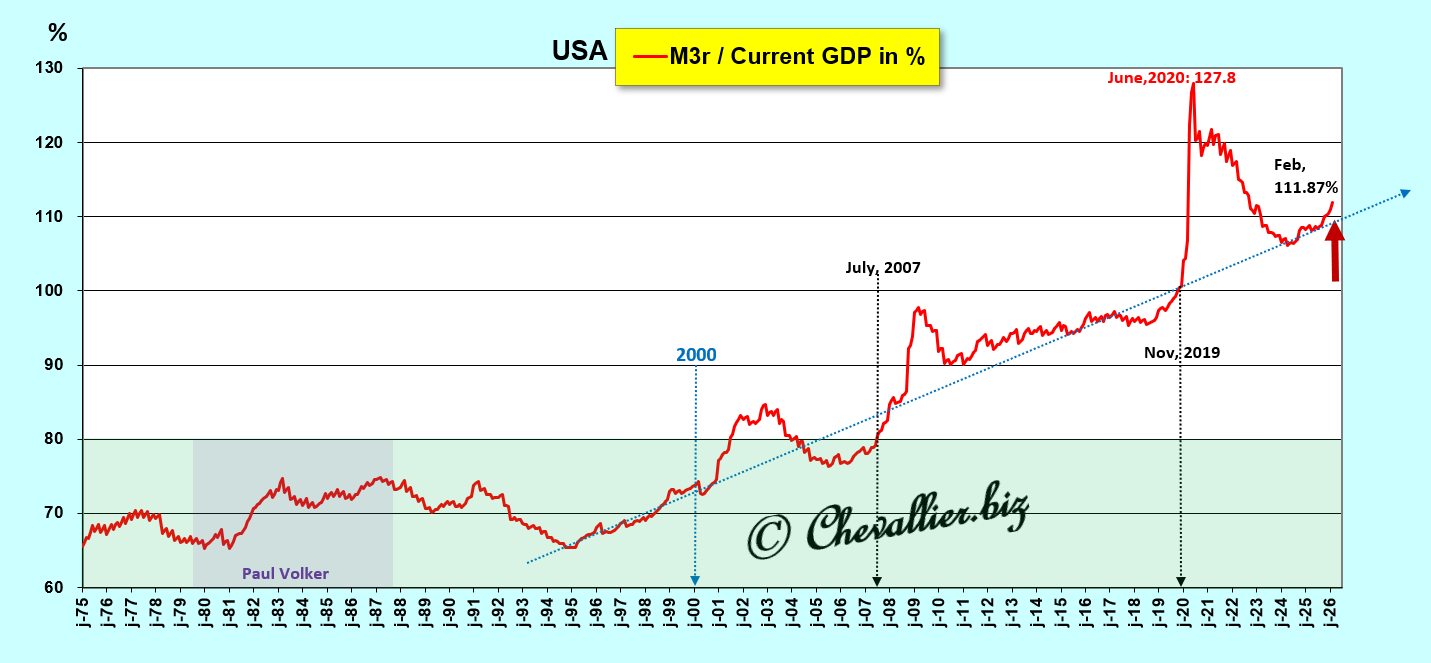
This last graph (Document 2) shows very clearly that the M3/GDP ratio (as a percentage) fluctuated around 70% from 1976 to the year 2000 because U.S. authorities at the time vigorously defended the discipline necessary for the U.S. monetary system to adhere to this essential prudential rule, namely an M3/GDP ratio below 80%.
Indeed, America was then strongly committed to defending the free world against communism, which enjoyed its heyday in the 20th century, prior to the collapse of the USSR.
To this end, the necessary condition for the success of liberal capitalism was to maintain sound money under all circumstances, which was effectively achieved.
However, subsequently, the pressure exerted by financial sector leaders on U.S. authorities was so intense that they were able to develop new financial products that made their fortunes at the expense of national interests.
For example, derivatives (including CDSs) were developed in the early 2000s, and Bitcoin and cryptocurrencies starting in 2010.
Furthermore, bank executives exerted strong pressure on monetary authorities to stop adhering to the restrictive regulations that had maintained public confidence in their banks during the second half of the 20th century.
For example, the prudential debt rule established by good old Greenspan—which recommended an equity ratio exceeding 10% of total debt—is now nothing more than a distant memory of a bygone era…
Another example of banking excesses: private credit, which should never have existed, is now beginning to pose major problems, even for official banks!
***
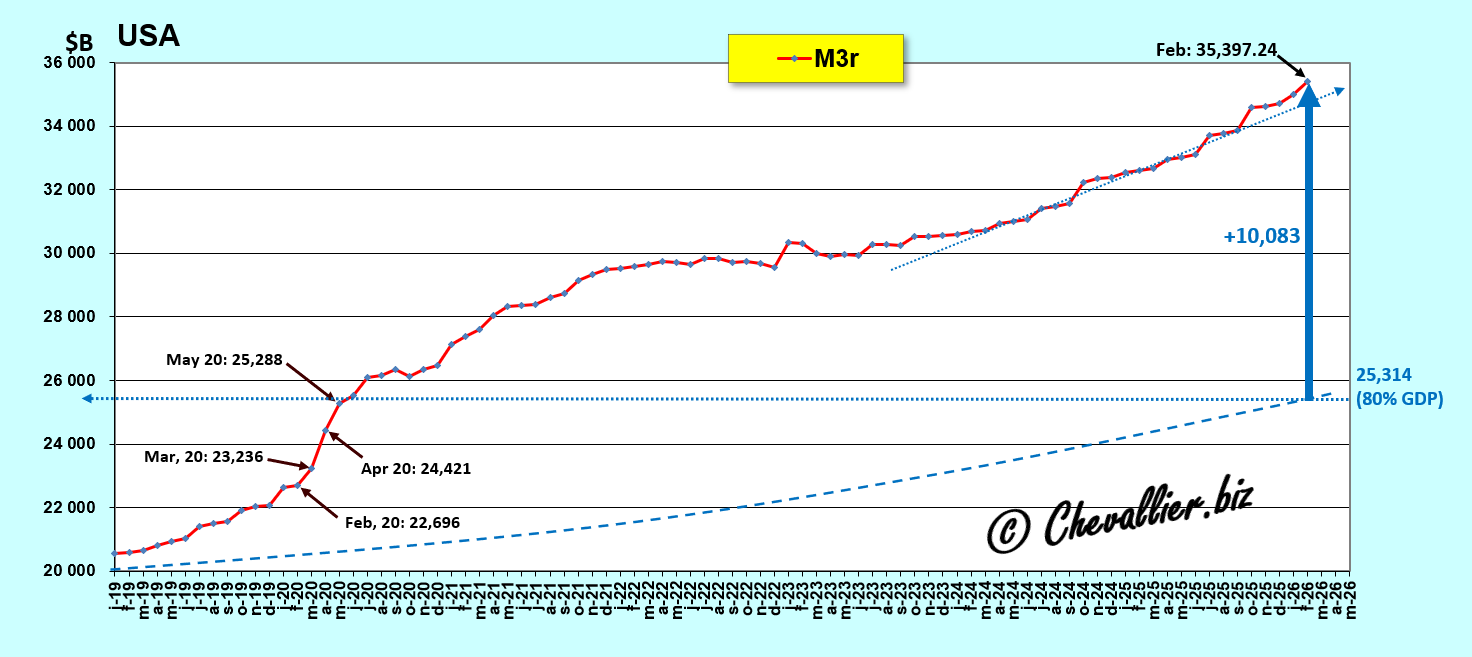
A closer look at the recent period, since 2019, shows that the second derivative of the M3r money supply has been rising at an alarming rate since the end of October 2025…
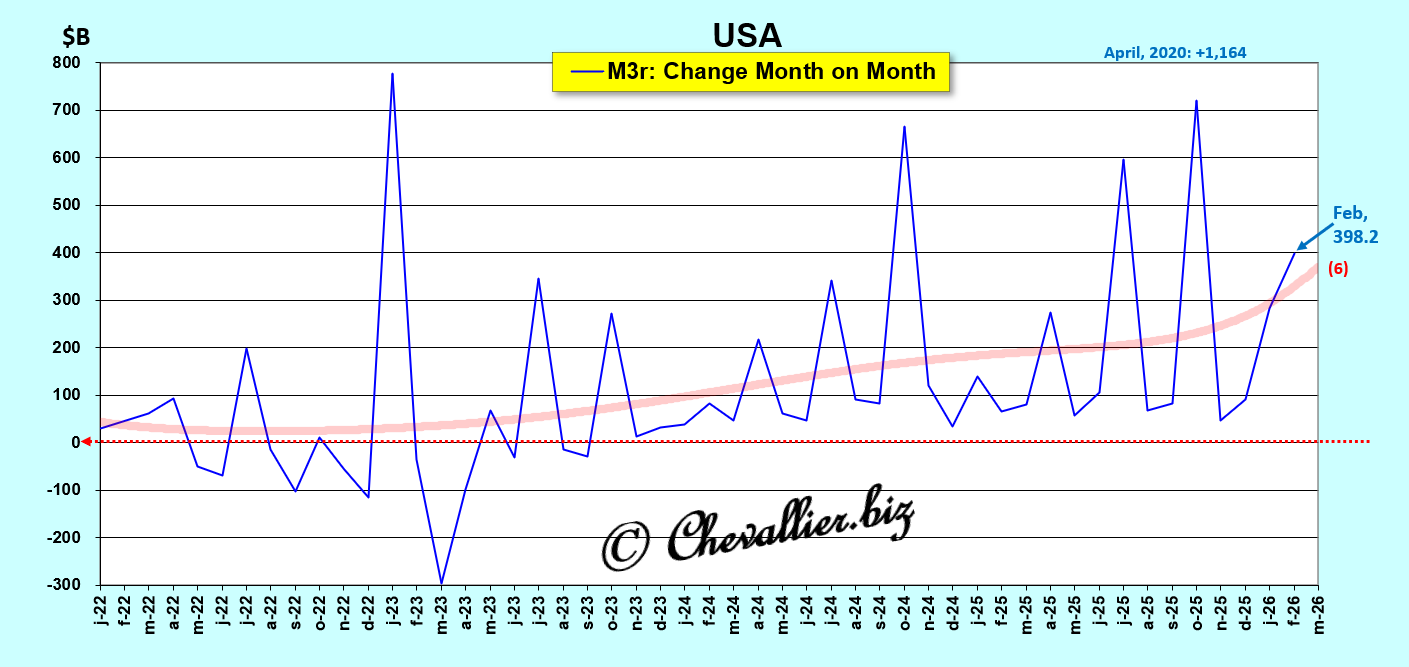
Document 3:
The month-over-month variations in this M3r money supply over the long term confirm that these financial turbulences began to manifest in the late 1990s and became extraordinary starting in the fall of 2005, the date on which Ben Bernanke was chosen to lead the Fed because he was renowned as an expert in crisis management for having brilliantly studied the 1929 crisis.
Document 4:
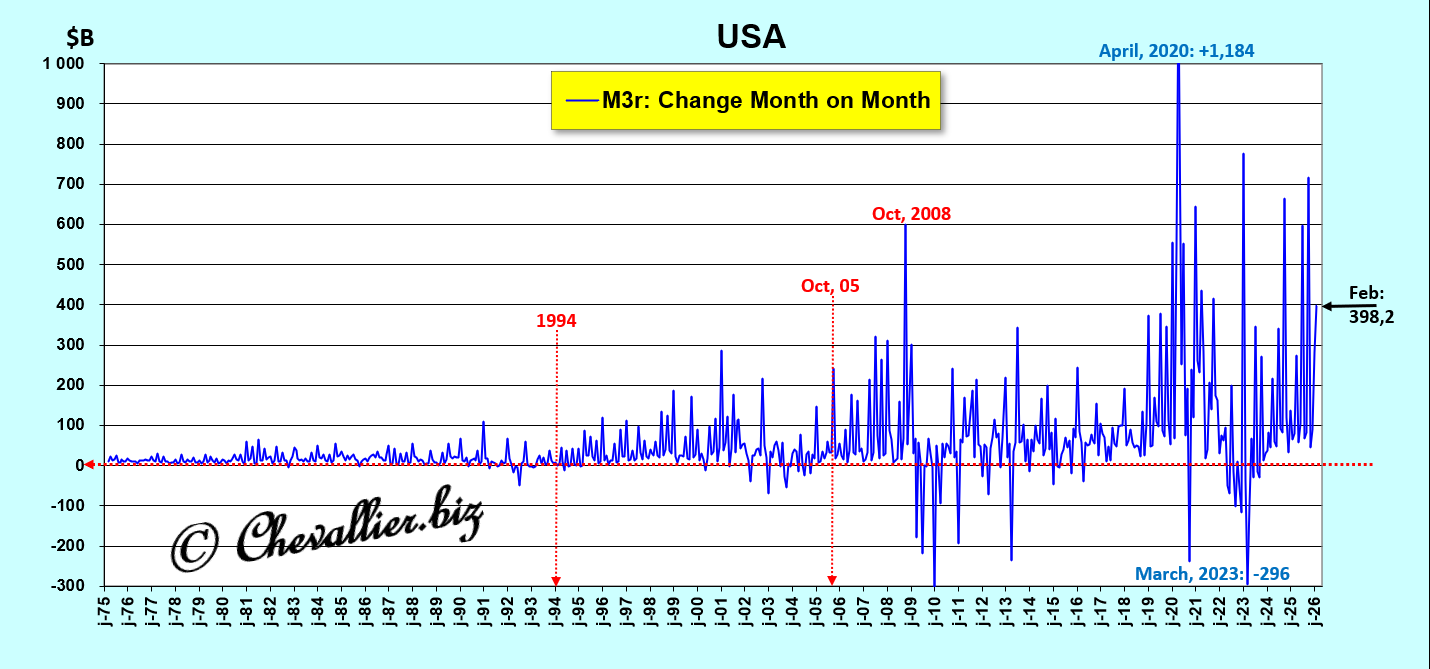
Indeed, the month-over-month increase in the M3r money supply was $398.2 billion last February, continuing an upward trend.
Document 5:
***
As a reminder, sound money is the first pillar of Reaganomics, according to Arthur Laffer, which means that the ratios of monetary aggregates to current annual GDP (as a percentage) must not exceed certain limits derived from observing their evolution over the long term, since the postwar period, in the United States.
As a reminder, a nation’s total money supply, denoted M3, is the sum of three monetary aggregates…
The monetary aggregate M1 is the sum of positive current account balances and currency in circulation, and this M1/GDP ratio (as a percentage) must not exceed 15% of GDP.
The monetary aggregate M2 consists of the sum of the M1 aggregate and the M2-M1 aggregate, which includes savings account deposits. This M2-M1/GDP ratio (as a percentage) must be less than 40% of GDP.
Finally, the M3-M2 aggregate corresponds to the total cash holdings of corporations and money market funds. This M3-M2 / GDP ratio (as a percentage) must be less than 25% of GDP.
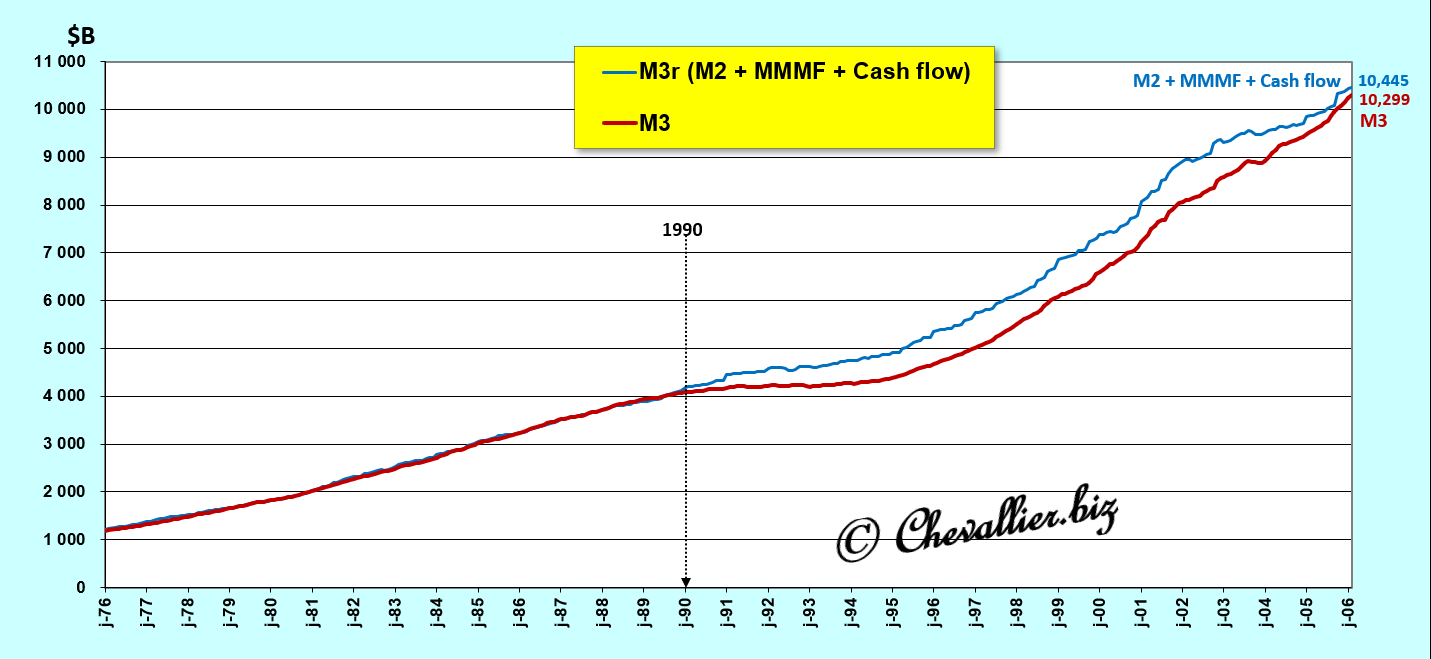
Document 6:
However, the problem is that since 2006, Ben Bernanke has banned the publication of the total U.S. money supply, M3, as soon as he took office as Fed Chair in February 2006, so that monetarist economists could no longer analyze it and draw conclusions that are nonetheless essential.
However, I have managed to reconstruct the amount of the U.S. M3 money supply, denoted M3r with an r for revised, based on the components that make up the M3-M2 aggregate, which are still published elsewhere…
Indeed, a nation’s total money supply M3 consists, on the one hand, of the monetary aggregate M2 (whose figures are still published monthly in the United States) and, on the other hand, of money market mutual funds (MMMF) and corporate net cash flow.
Our friend Fred de Saint Louis publishes these data for Money Market Mutual Funds (MMMF) under the code MMMFFAQ027S and for corporate net cash flow under the code CNCF.
Thus, for the period up to 1990, the curves derived from the series published by our friend Fred de Saint Louis based on M3 aggregate figures coincide perfectly with those of the money market mutual funds and corporate net cash flow figures.
Subsequently, a divergence becomes apparent, which eventually tends to narrow in 2006.
Document 7:
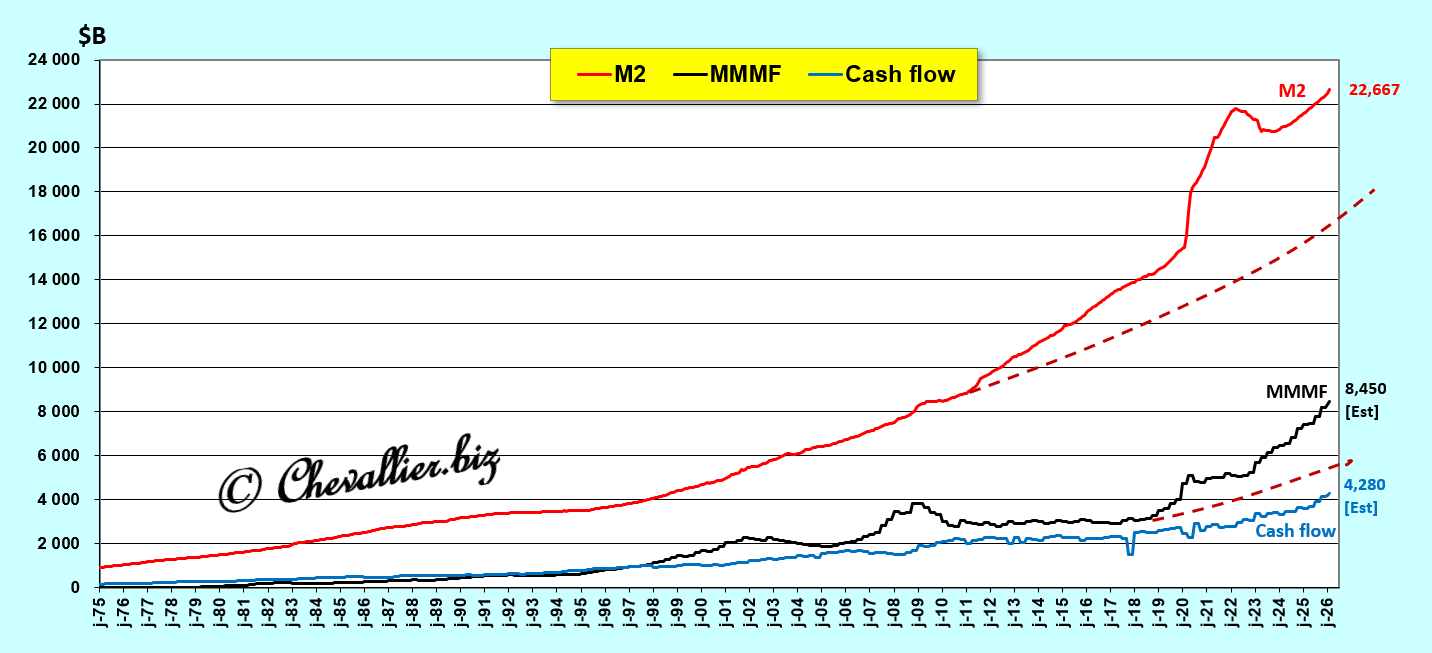
Thus, using the M3-M2 monetary aggregate defined by data on money market funds and total corporate cash allows us to track the evolution of the U.S. M3 money supply from February 2006 through February 2026—the latest figures published to date for the M2 monetary aggregate— with the other data estimated to be consistent with the trend of the previous quarter (pending the publication of figures for the first quarter of 2026), which provides the most accurate picture of reality possible.
Document 8:
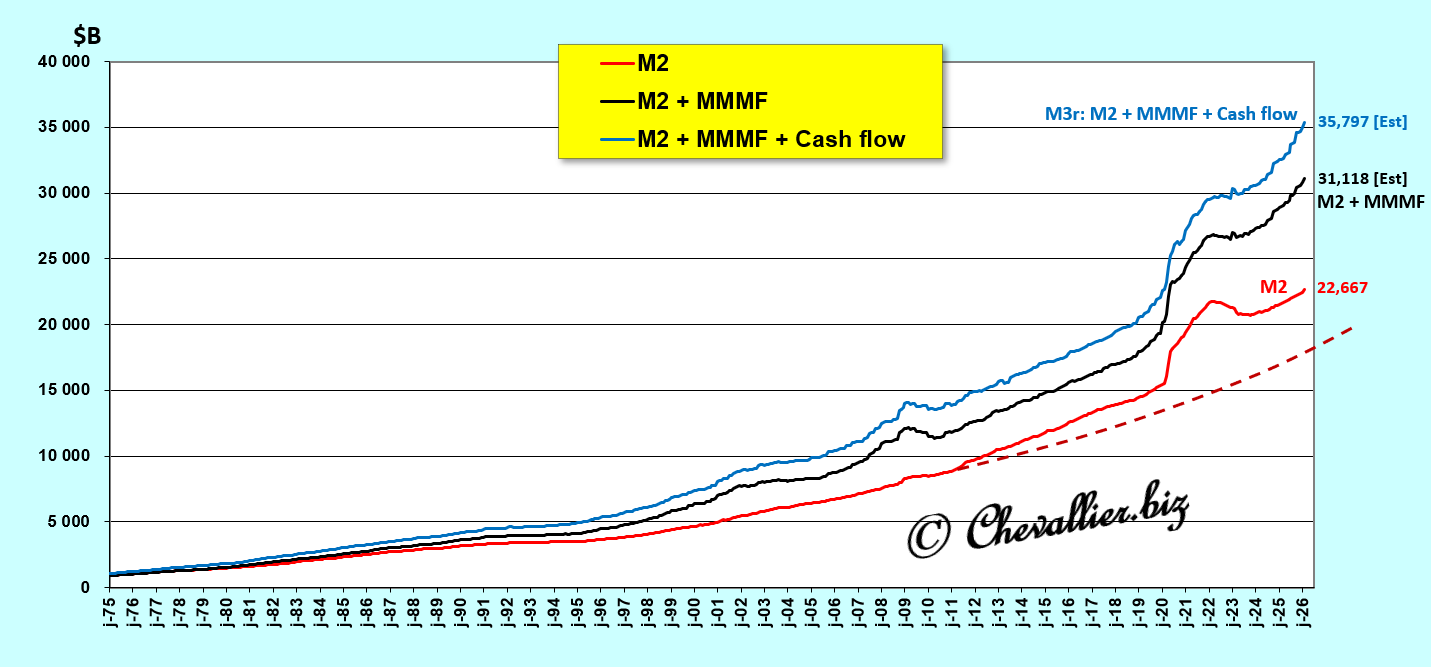
[The dashed lines correspond to a trend that would have been normal for the series]
These curves, drawn from statistical series published by U.S. authorities, highlight that the increase in this hypertrophy of the M3r money supply is primarily caused by the extraordinary rise in money market funds and, to a lesser extent, by that of cash flows.
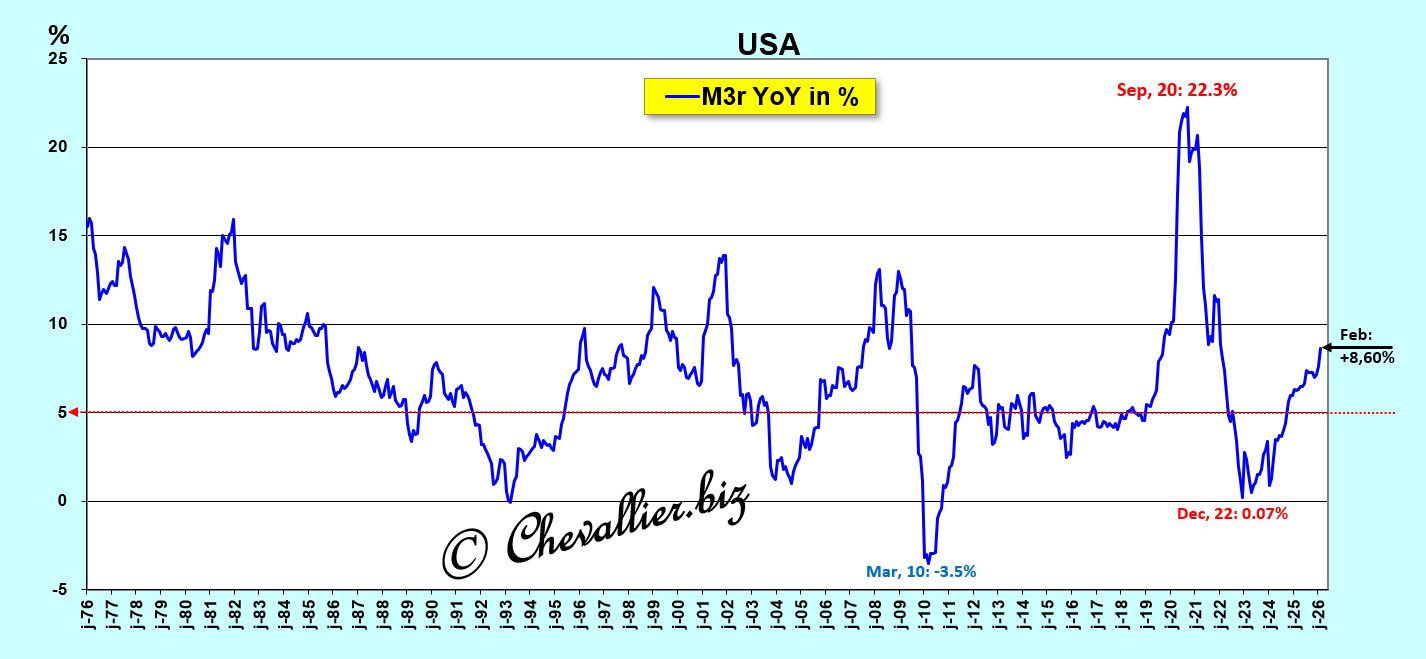
Document 9:
The year-over-year variations in the M3r money supply are not significant, especially after the severe, completely abnormal turbulence from 2020 to 2023 due to this coronavirus situation,
Document 10:
The velocity of money is the ratio of GDP to M3r, that is, the inverse of the M3/GDP ratio (as a percentage). This is not a practical concept.
It is preferable to use the M3/GDP ratio as a percentage, which is easier to understand.
Document 11:
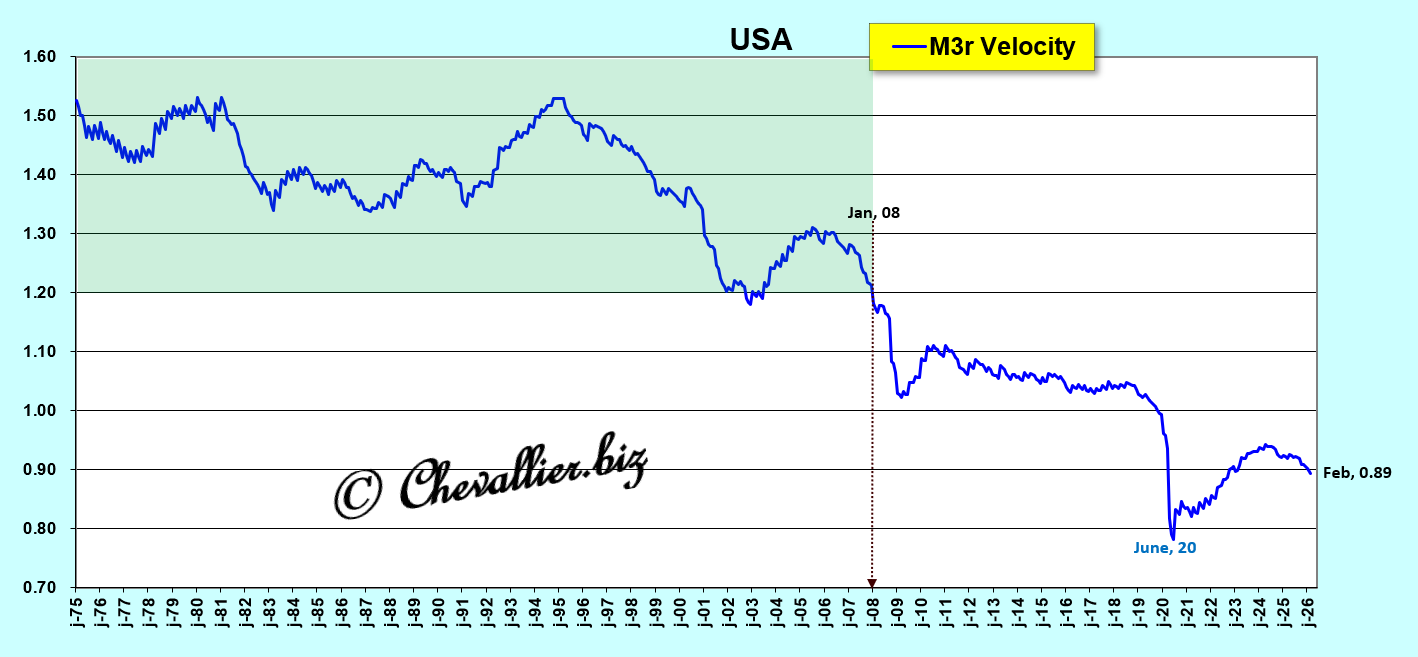
However, this velocity of circulation of the money supply is a concept useful for educational purposes because it helps justify the fact that the faster money circulates, the more growth is stimulated, and vice versa.
***
These data, once clarified and analyzed, help us understand the relationships between changes in a nation’s M3 money supply and those in its real GDP…
Analyses and conclusions regarding the impact of changes in monetary aggregates on real GDP have not been taken into account by financial market participants for the past twenty years, even though these are issues and solutions that form the very foundation of any nation’s economic activity.
This is why Ben Bernanke took steps to ensure that the Fed would no longer publish weekly figures for the M1, M2, and M3 monetary aggregates once he assumed the role of chairman of the Fed in February 2006.
Subsequently, Jerome Powell added another layer of opacity by publishing only monthly data for the M2 monetary aggregate.
Thus, only those working within the Fed have access to this fundamental data, and they can manipulate financial reporting and the financial markets as they see fit!
***
The conclusions that can be drawn from this data therefore confirm that monetary hypertrophy (always lethal in the long run) poses a serious threat to the United States at any time, especially in the event of exogenous disruptions—which is indeed the case at the start of 2026 with this war against Iran.
Consequently, a major crisis is brewing, in line with Arthur Laffer’s adage: the first pillar of Reaganomics (and monetarism) is sound money, which means that a nation must always maintain an M3/GDP ratio below 80%, which is not currently the case!
***
The data on money market mutual funds (MMMF) are those coded MMMFFAQ027S by our friend Fred from St. Louis.
Click here to access it.
The data for the fourth quarter of 2025 for money market mutual funds (MMMF) and corporate cash holdings (CNCF) are those published by the authorities and reported by our friend Fred from Saint Louis.
Click here to read my previous article on this topic.
Click here to view this article on my website in French.
© Chevallier.biz